

Key facts
Last reviewed
- Surface area of Lough Neagh, the UK’s largest lake
383 km²
Surface area of Lough Neagh, the UK’s largest lake
- Share of Northern Ireland’s drinking water it supplies
40%
Share of Northern Ireland’s drinking water it supplies
The bloom moves. The results arrive later.
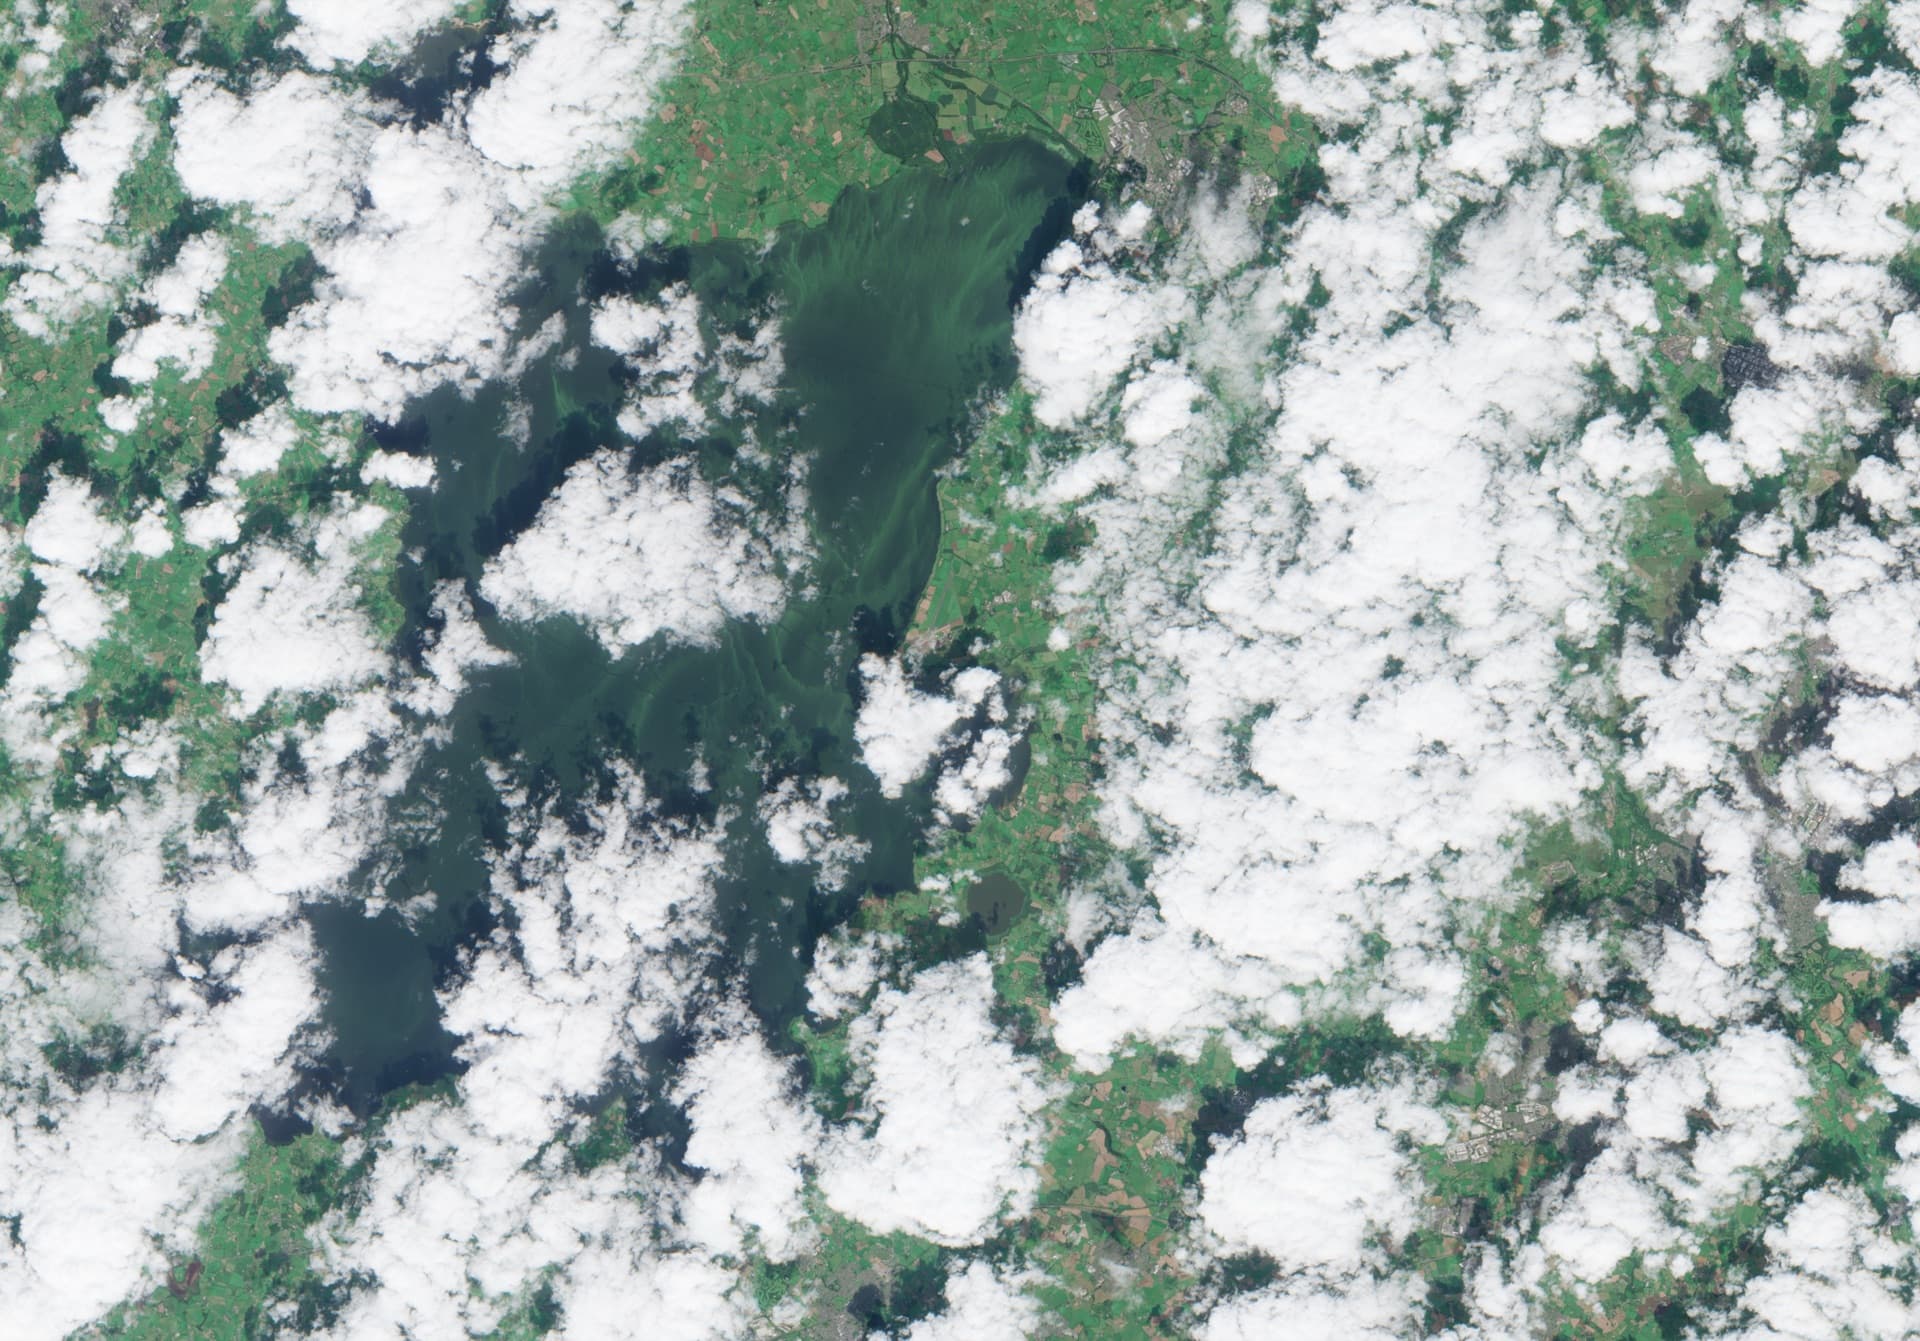
Lough Neagh is the UK's largest lake and supplies 40% of Northern Ireland's drinking water. Harmful algal blooms have intensified there, threatening water quality, ecosystem health and public safety.
Traditional monitoring relies on manual sampling and lab analysis. By the time results come back, the blooms have moved. Resources deployed reactively. Coverage sparse: a few sampling points across 383 square kilometres.
Understanding the whole system, not just the lake.
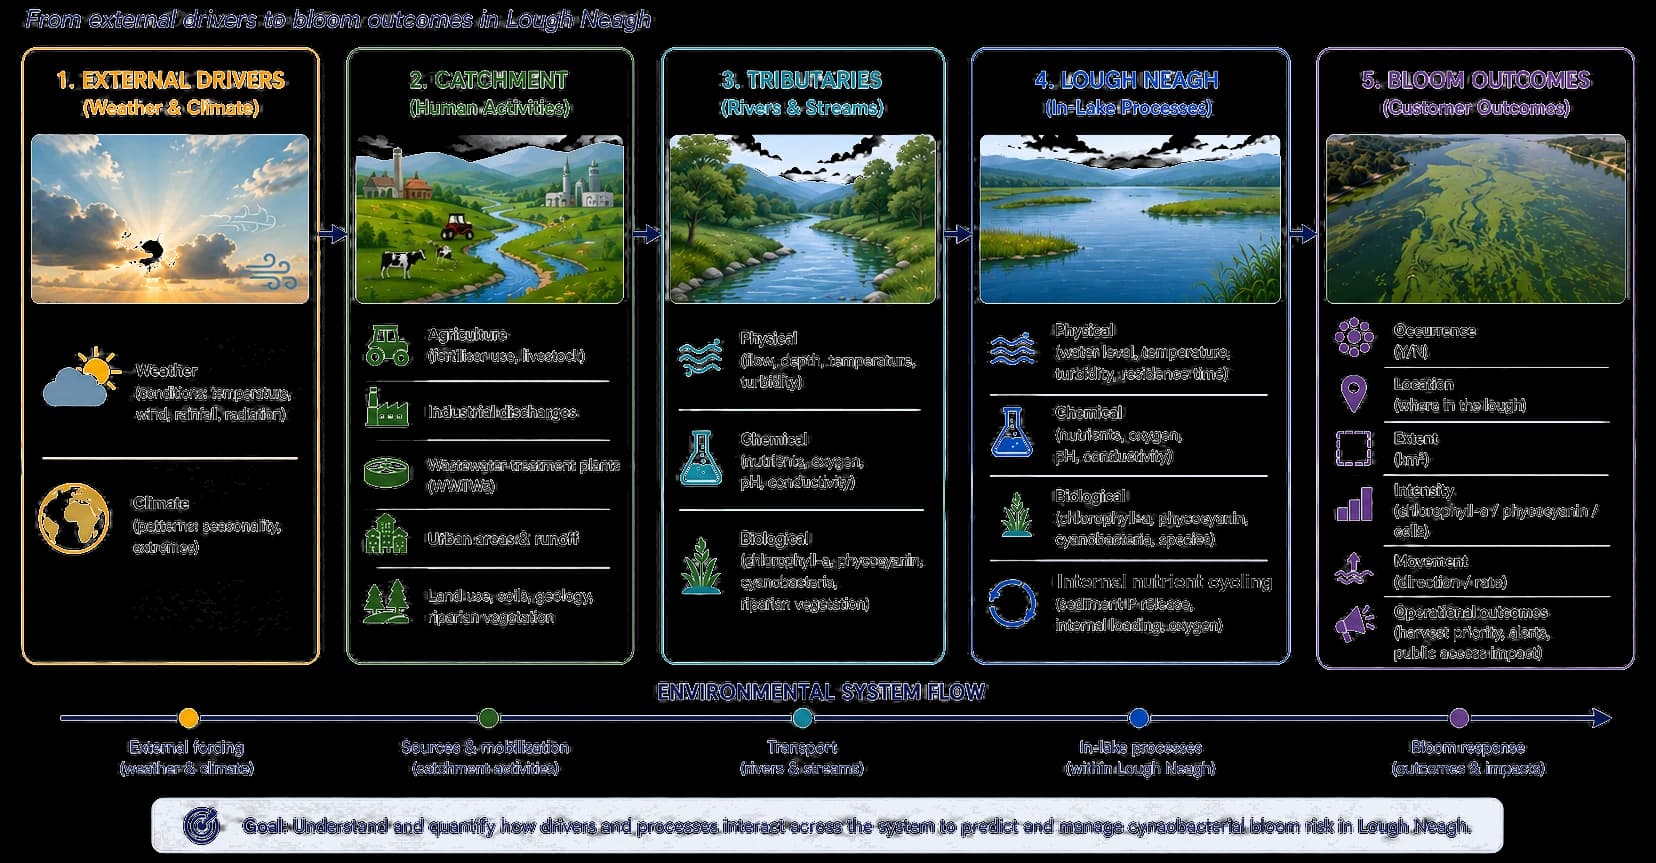
Blooms in Lough Neagh are shaped long before they reach the lake: weather and climate, land use and nutrient inputs across the catchment, and what the tributaries carry in. Amelia maps the full chain from external drivers to bloom outcomes, rather than monitoring the lake in isolation.
Environmental system overview: the five stages
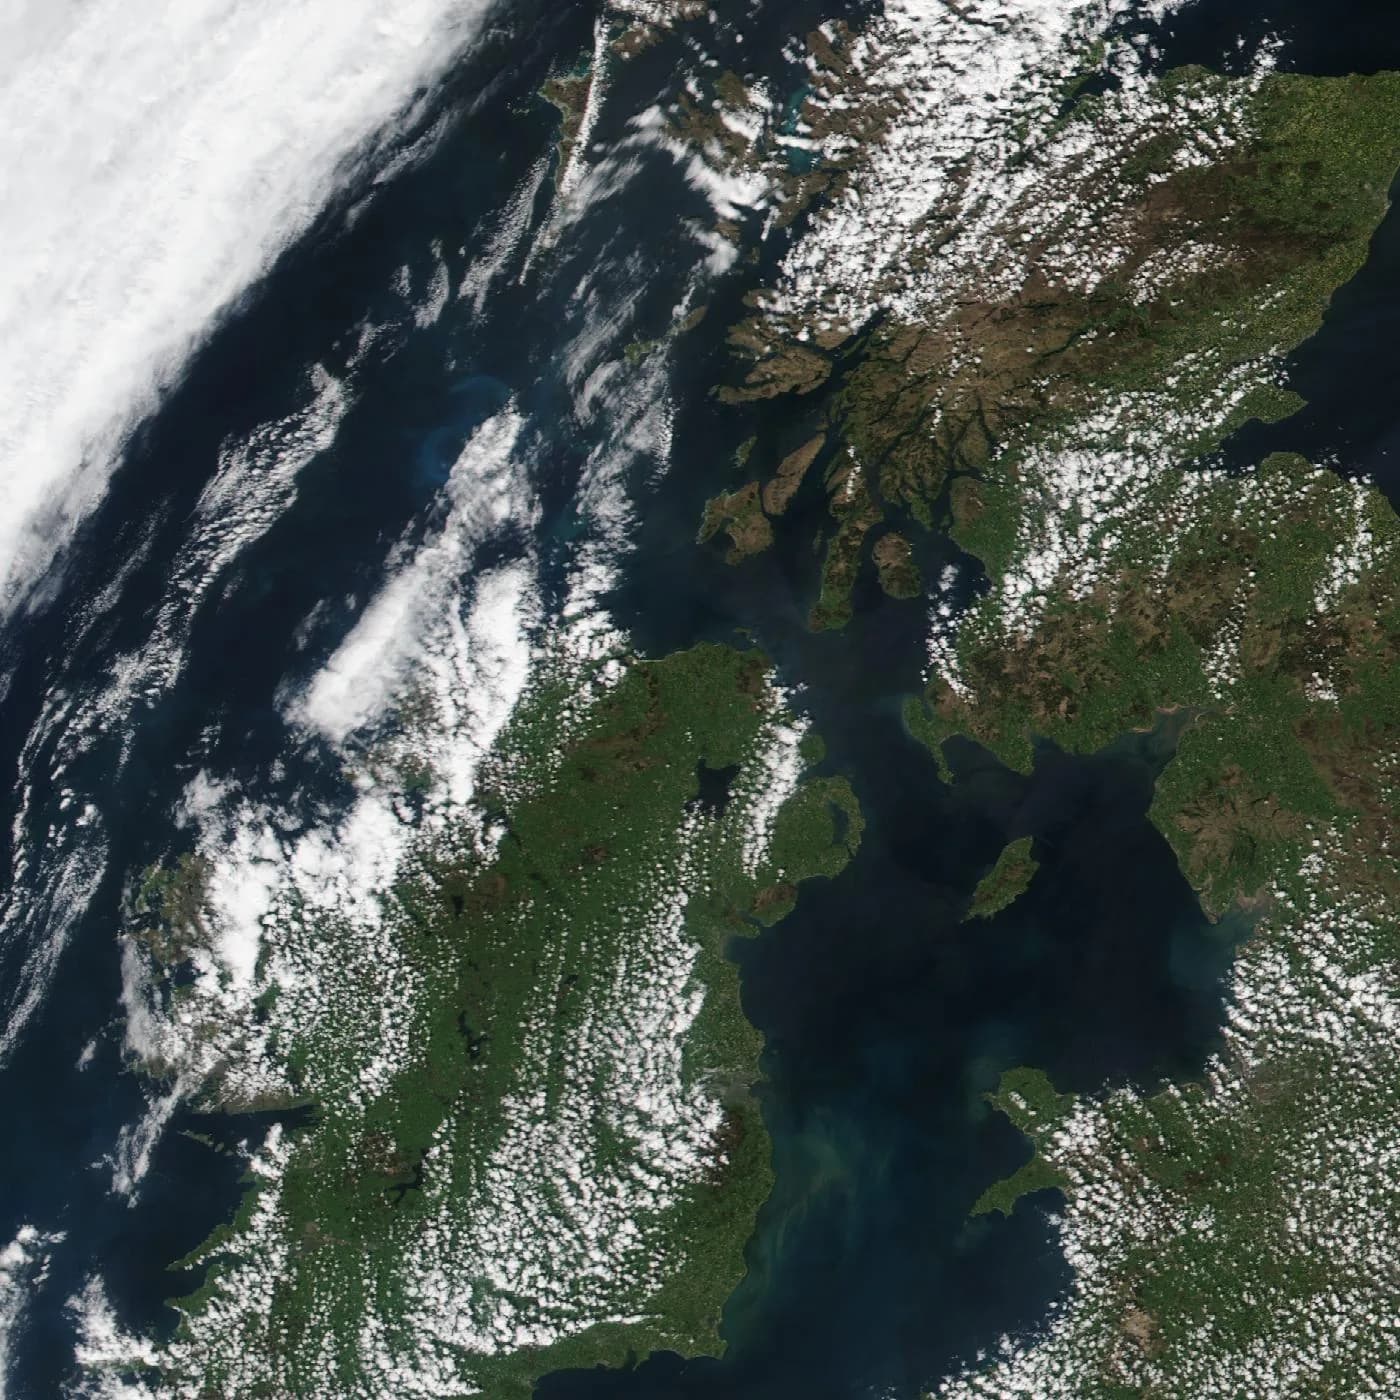
Real satellite view of each stage
1. External Drivers
| Parameter | Unit |
|---|---|
| Air temperature | °C |
| Wind speed | m/s |
| Wind direction | ° |
| Rainfall | mm/day |
| Solar radiation | W/m² |
| Cloud cover | % |
| Day length | hours |
2. Catchment
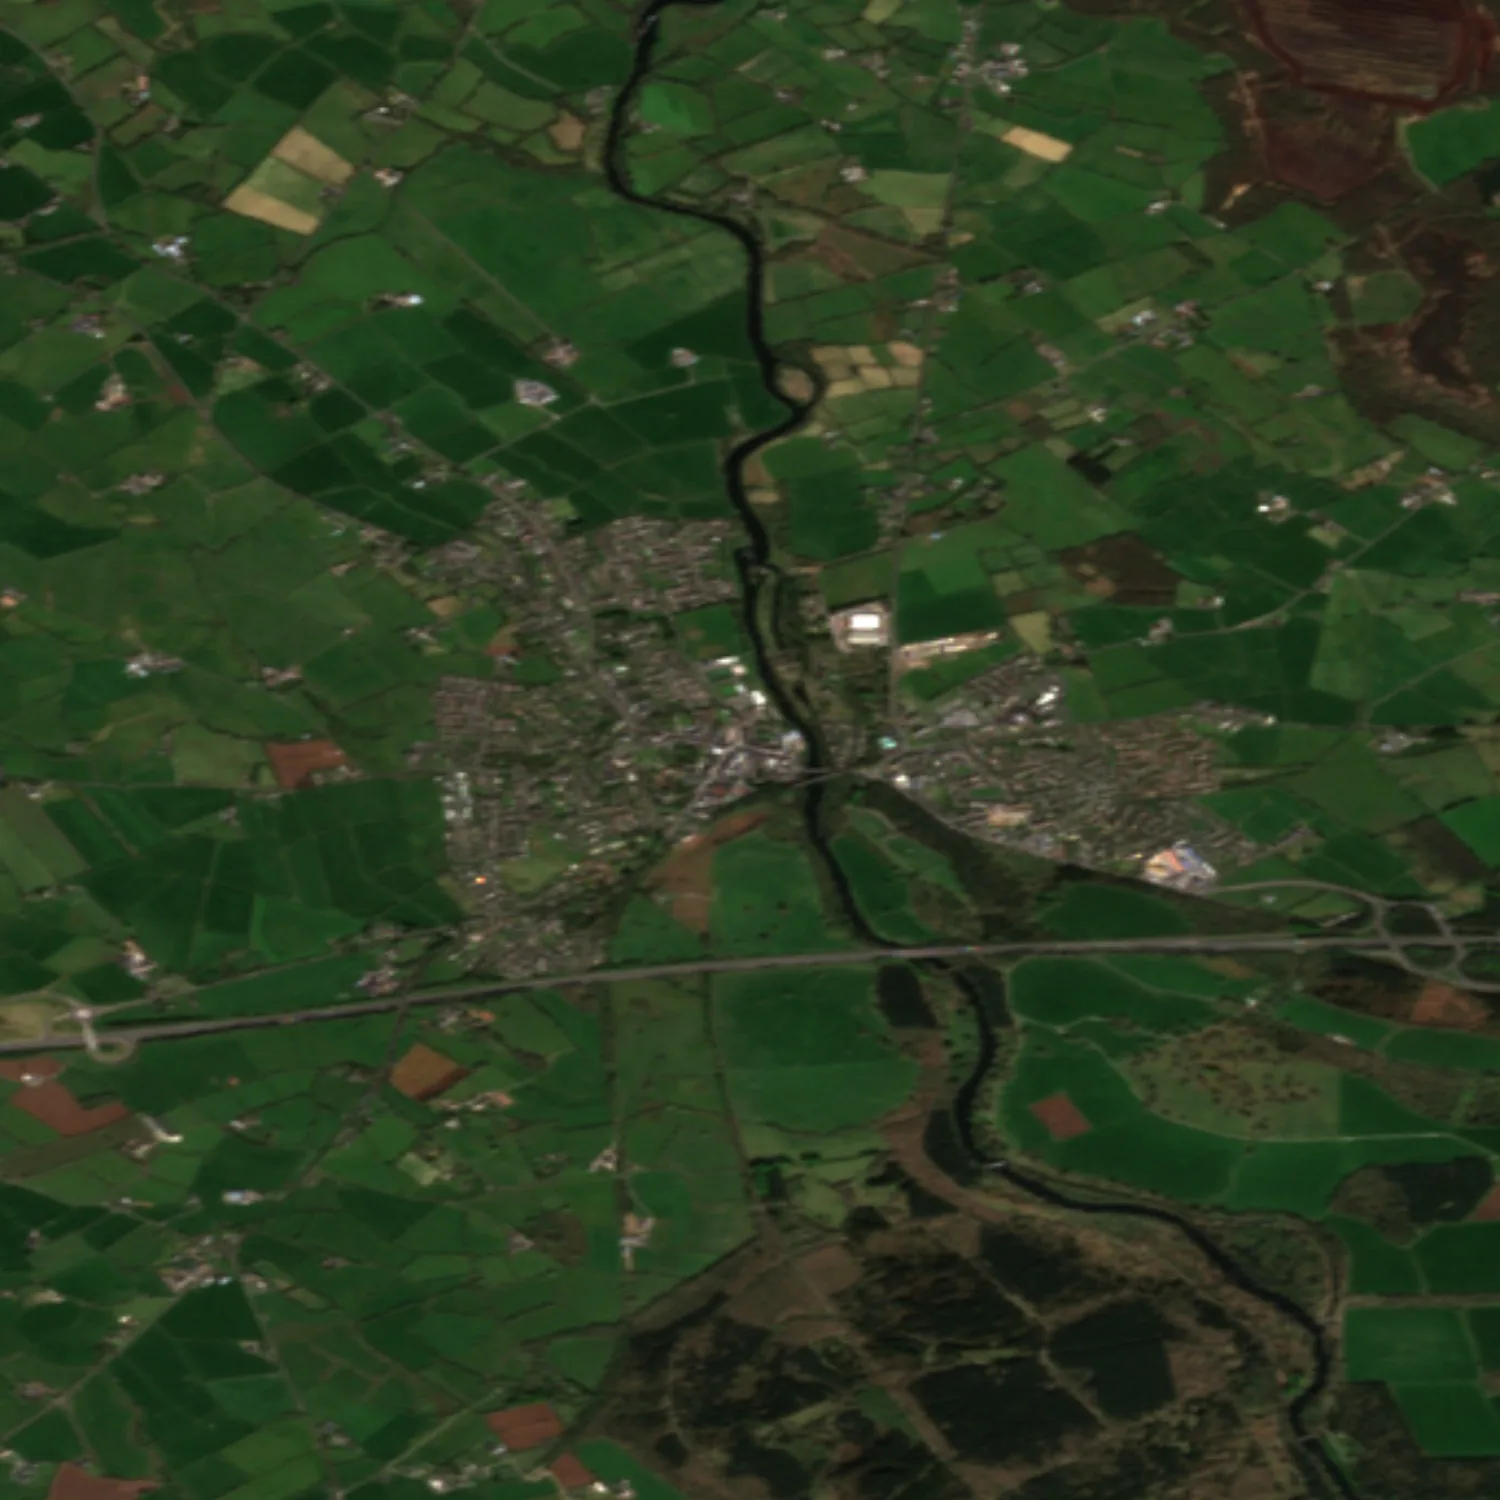
Land use and human activities
| Parameter | Unit |
|---|---|
| Agricultural land | % catchment area |
| Urban land | % catchment area |
| Peatland / wetland | % catchment area |
| Forestry | % catchment area |
| Fertiliser application (N & P) | kg P/ha/yr; kg N/ha/yr |
| Livestock density | livestock units/ha |
| Wastewater treatment works (WWTWs) | No. and/or m³/day |
| Industrial discharges | No. and/or m³/day |
Catchment characteristics
| Parameter | Unit |
|---|---|
| Soil type | Category |
| Geology | Category |
| Topography / slope | % or degrees |
Transport processes (to investigate further)
| Parameter | Unit |
|---|---|
| Surface runoff | mm/day |
| Sediment transport / suspended sediment load | mg/L or t/day |
| Nutrient export (P & N) | kg P/day; kg N/day |
3. Tributaries
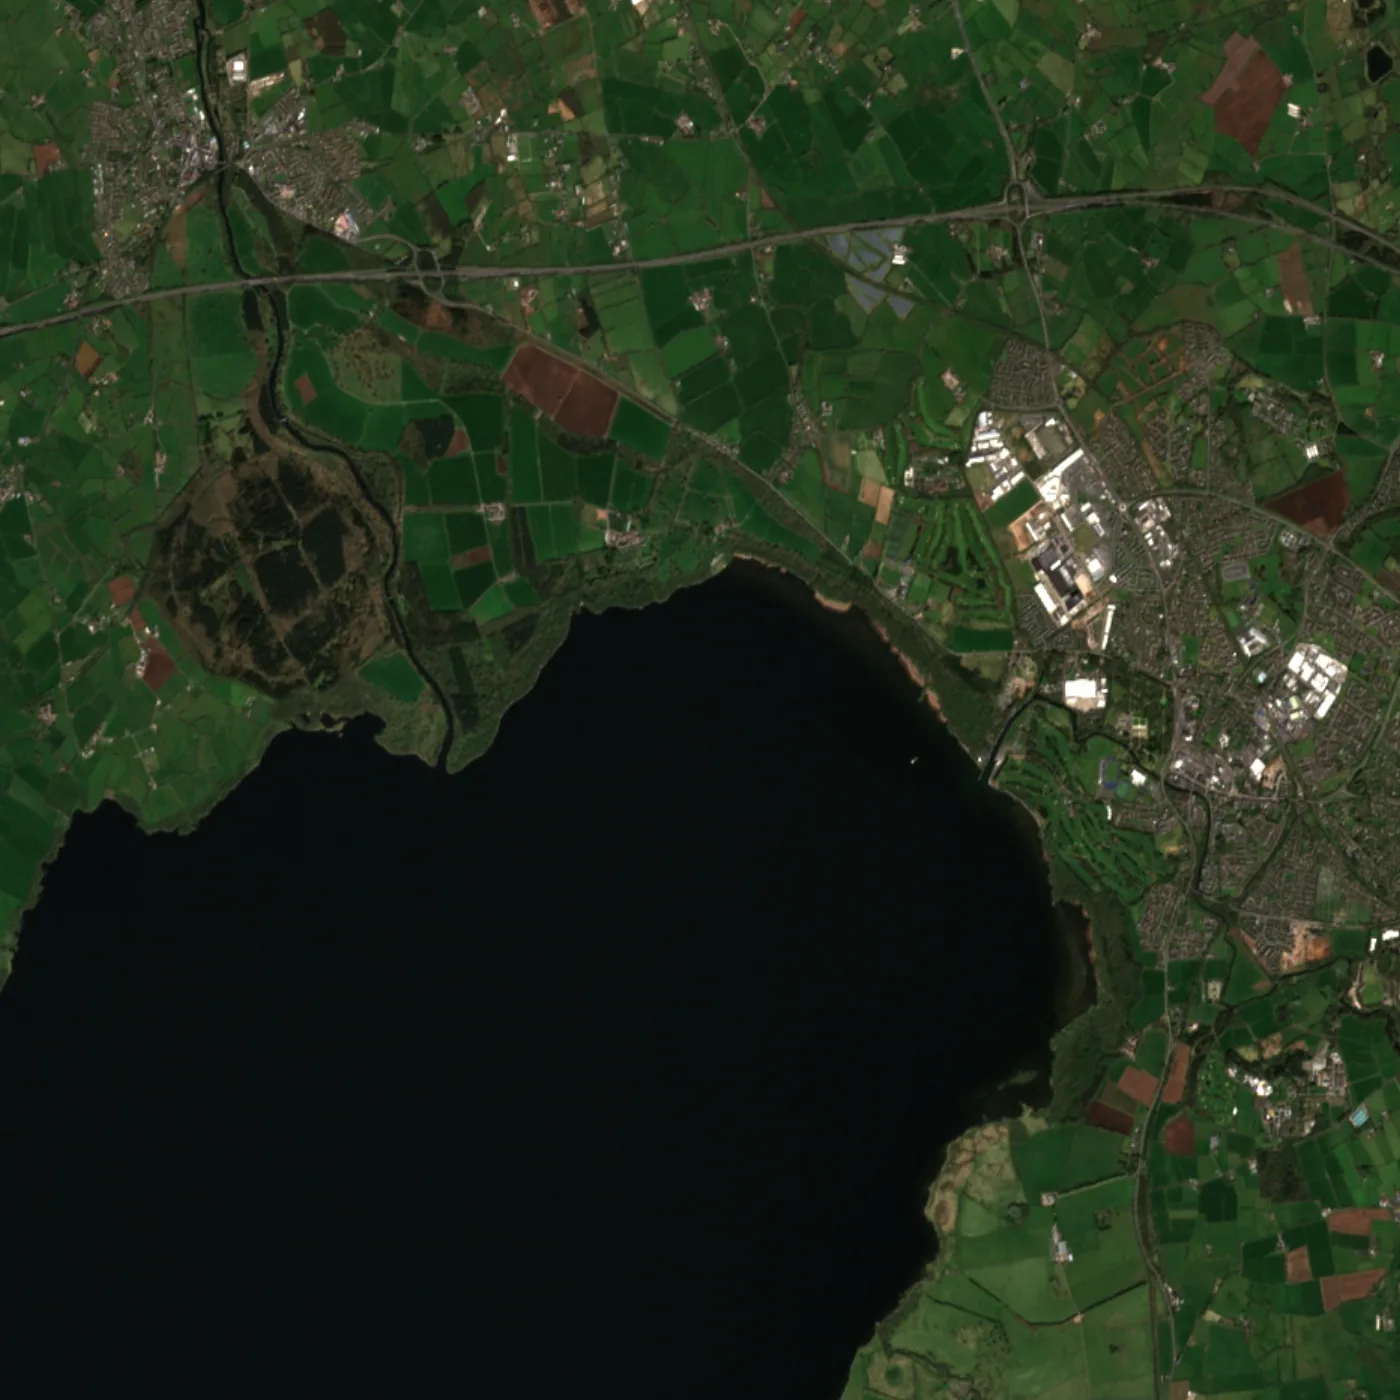
Physical
| Parameter | Unit |
|---|---|
| Flow rate / river discharge | m³/s or L/s |
| Water depth | m |
| Water temperature | °C |
| Turbidity | NTU |
| Channel morphology | Category |
| Riparian buffer width | m |
Chemical
| Parameter | Unit |
|---|---|
| Total phosphorus | mg/L |
| Soluble reactive phosphorus | mg/L |
| Total nitrogen | mg/L |
| Nitrate | mg/L |
| Ammonium | mg/L |
| Dissolved oxygen | mg/L |
| pH | pH units |
| Conductivity | µS/cm |
Biological / ecological
| Parameter | Unit |
|---|---|
| Chlorophyll-a | µg/L |
| Phycocyanin | µg/L or RFU |
| Cyanobacteria abundance | cells/mL |
| Benthic algae | Category / score |
| Macroinvertebrate diversity | Index |
| Riparian vegetation condition | % cover or score |
Other indicators
| Parameter | Unit |
|---|---|
| Suspended sediment | mg/L |
| Nutrient ratio (N:P) | ratio |
| Water colour | Pt-Co |
| Dissolved organic carbon (DOC) | mg/L |
| Water transparency (Secchi) | m |
4. Lough Neagh
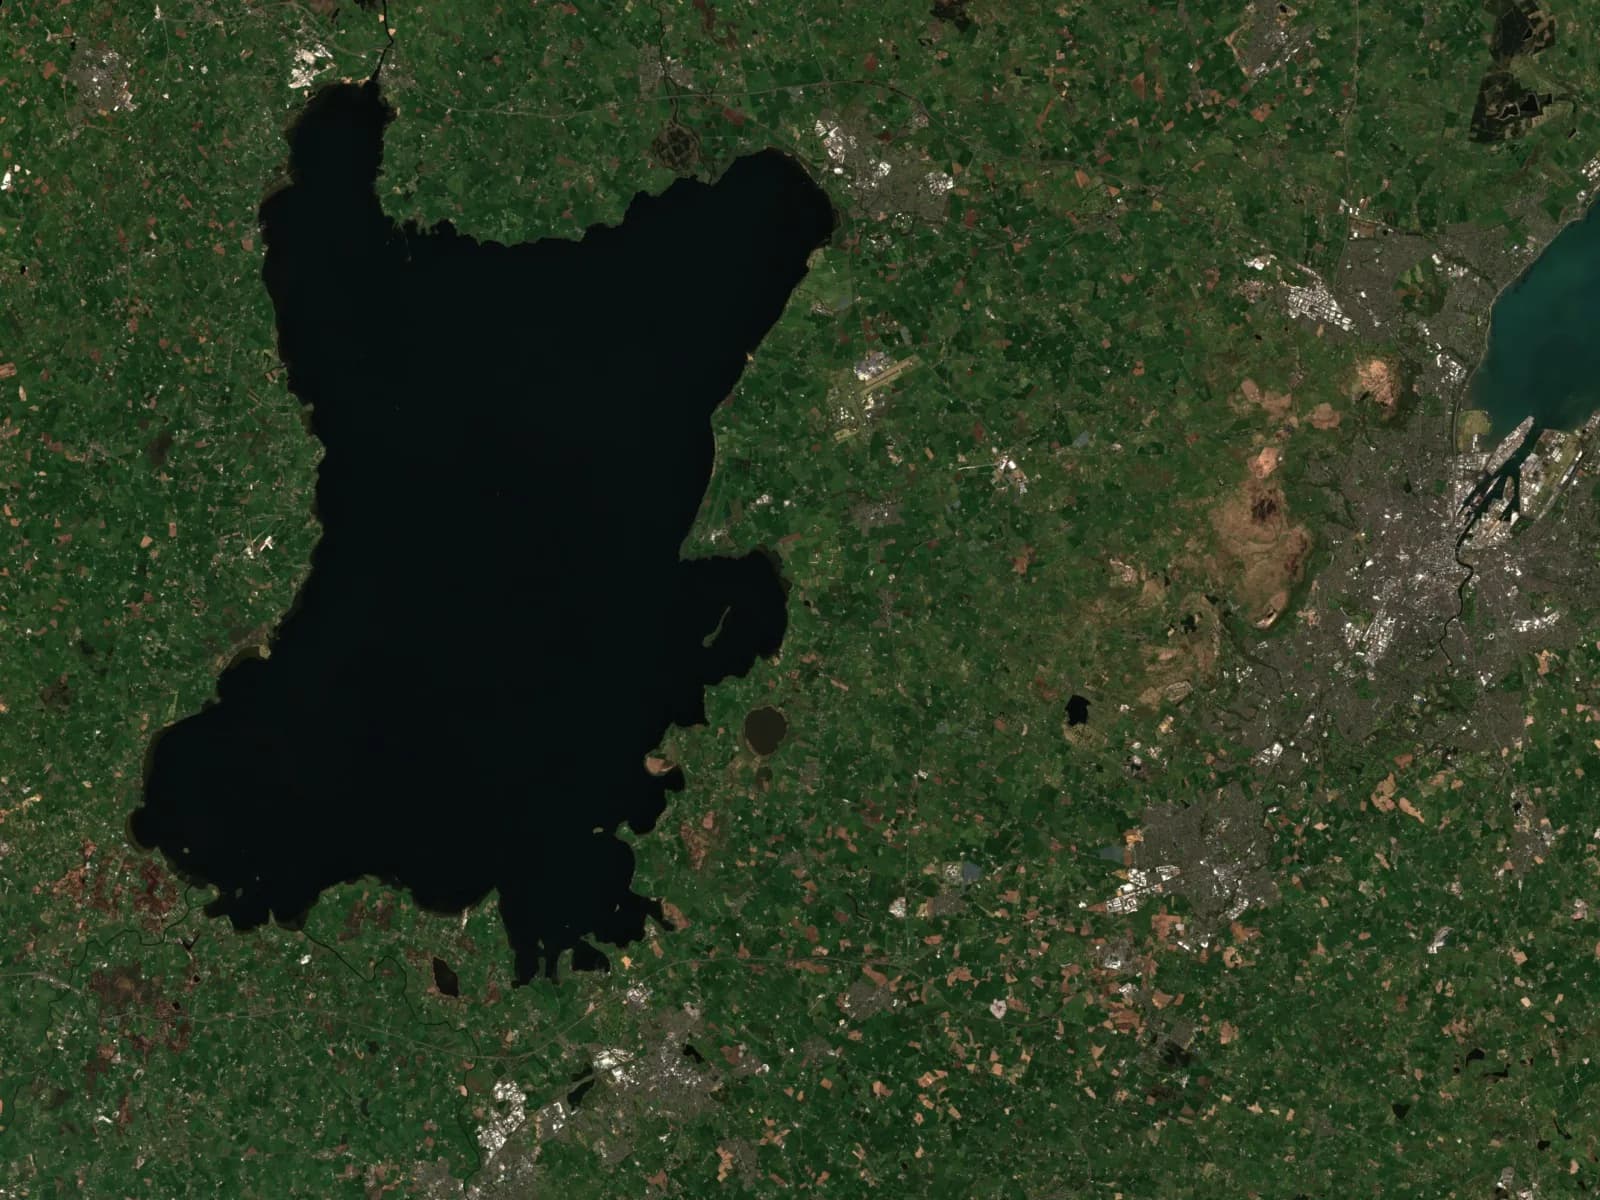
Physical
| Parameter | Unit |
|---|---|
| Water temperature | °C |
| Water level | m |
| Depth / bathymetry | m |
| Residence time | days |
| Turbidity | NTU |
| Mixing / stratification condition | Category |
| Wind exposure / fetch | Category |
Chemical
| Parameter | Unit |
|---|---|
| Total phosphorus | mg/L |
| Soluble reactive phosphorus | mg/L |
| Total nitrogen | mg/L |
| Nitrate | mg/L |
| Ammonium | mg/L |
| Dissolved oxygen | mg/L |
| pH | pH units |
| Conductivity | µS/cm |
Biological / ecological
| Parameter | Unit |
|---|---|
| Chlorophyll-a | µg/L |
| Phycocyanin | µg/L or RFU |
| Cyanobacteria abundance | cells/mL |
| Cyanobacterial / phytoplankton species composition | % relative abundance |
| Zebra mussel abundance | individuals/m² or biomass/m² |
| Aquatic macrophytes (abundance) | % cover |
| Fish community | Index |
Internal phosphorus cycling (to investigate further)
| Parameter | Unit |
|---|---|
| Sediment phosphorus release | mg P/m²/day |
| Internal phosphorus loading (diffusive + resuspension) | mg P/m²/day |
| Bottom-water oxygen concentration | mg/L |
| Sediment phosphorus concentration | mg P/kg |
5. Bloom Outcomes
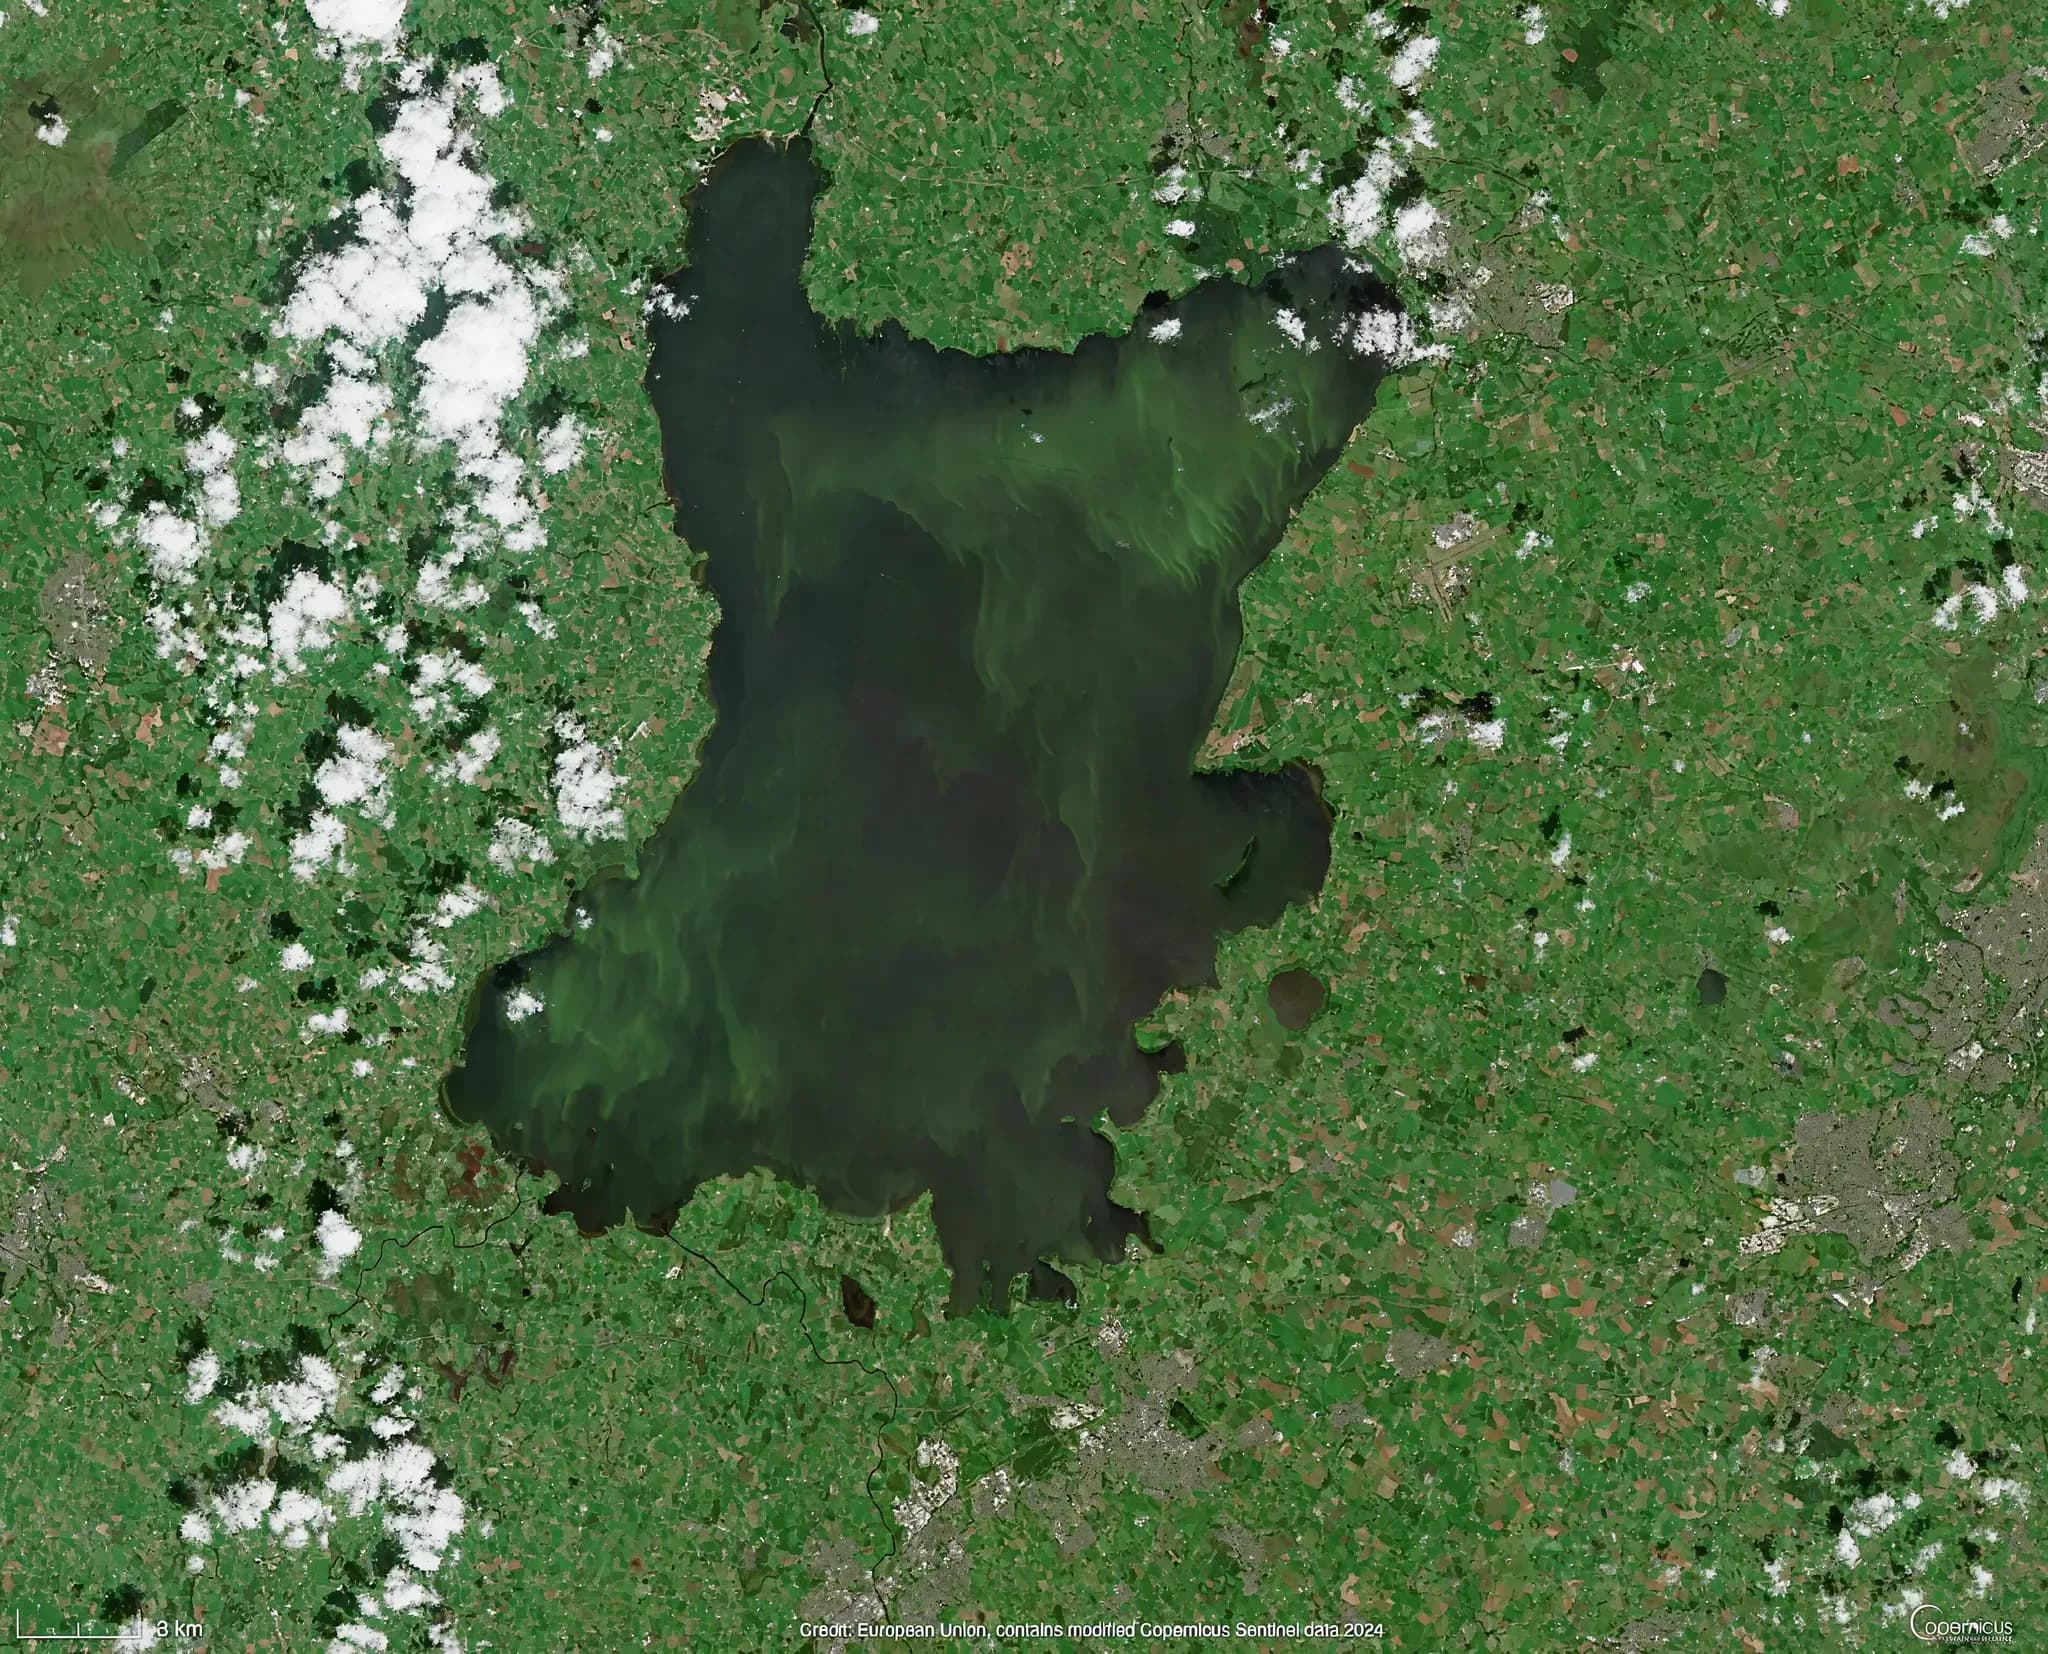
Bloom state
| Parameter | Unit |
|---|---|
| Bloom occurrence | Yes/No |
| Bloom location | Coordinates / GIS layer |
| Bloom extent | km² |
| Bloom intensity | Chl-a µg/L, phycocyanin, or cells/mL |
| Bloom movement / displacement | m/day or spatial displacement |
Operational outcomes
| Parameter | Unit |
|---|---|
| Harvest priority | Category / ranking |
| Harvest location | Coordinates / GIS layer |
| Monitoring priority | Category / ranking |
| Intervention priority | Category / ranking |
| Alert level | Category |
| Public access / tourism status | Open / Closed / Restricted |
| Route / deployment recommendation | GIS route / location |
From environmental understanding to actionable intelligence.
The systems analysis above is the foundation. Amelia brings it together with satellite, drone, sensor and ground-truth data, then layers forecasting and monitoring on top, so the output is not just data but a decision.
Data sources
Satellite EO
Drone
Buoys
In-situ sampling
Citizen science
Understand
Environmental system understanding
Everything from the systems analysis above, combined to identify the key drivers, interactions and processes that influence bloom dynamics.
Integrate
Data integration
Combine and harmonise multi-source environmental data into one picture.
Forecast
Bloom forecasting
Predict bloom risk, location, timing and confidence.
Act
Monitoring & decision support
Continuous monitoring, alerts, insights and operational recommendations.
Outputs
Harvest planning
Alerts
Monitoring priorities
Stakeholder portal
Satellite coverage. Continuous monitoring.
Multi-spectral satellite imagery mapped algal bloom concentrations across the entire lake surface, continuously. Multi-temporal analysis tracked bloom dynamics, revealing patterns invisible to point-sampling.
Complete spatial coverage. Continuous temporal monitoring. Priority intervention areas identified automatically.
Faster detection. Full-lake intelligence.
Full-lake coverage replaced sparse point sampling. Continuous monitoring replaced periodic checks. Decision-makers received actionable intelligence, not raw data, enabling faster and more targeted responses.
The same approach is offered as an ongoing service for harmful algal bloom monitoring, and runs on Amelia’s Planetary Intelligence Platform.
Common questions
What is the algal bloom problem at Lough Neagh?
How does satellite monitoring detect algal blooms?
Does satellite monitoring replace water sampling?
Can this approach work on other lakes and reservoirs?
What challenge would you bring to Amelia?
Whether it's water quality, emissions monitoring, feedstock verification, or something we haven't seen yet: if it involves understanding what's happening on the ground, we want to hear about it.