Sustainable Aviation Fuel
SAF Feedstock,
Verified from Space.
Sustainable Aviation Fuel (SAF) verification for producers and feedstock suppliers. Land-use history, classification, and chain-of-custody, mapped to ISCC, RSB, and ReFuelEU.
The Mandate
SAF blending is no longer optional.
Fuel suppliers at every major EU and UK airport must blend rising percentages of Sustainable Aviation Fuel (SAF) into their fuel mix, ramping toward 70% by 2050. Switzerland adopted the same regime on 1 January 2026. As volumes scale, certified feedstock becomes the binding constraint, not production capacity.
The Challenge
The feedstock exists. Proving it qualifies is the problem.
To sell SAF into ReFuelEU, EU RED III, or CORSIA markets, feedstock has to pass ISCC or RSB certification. Both schemes require specific evidence: feedstock origin, proof that no high-carbon-stock land was converted since 1 January 2008, proof that the material is genuinely waste or residue, and chain-of-custody through the supply chain. Getting this evidence today means manual site visits, paper audits, and fragmented datasets stitched together by hand (ISCC EU 202).
In 2024, the first reporting year under ReFuelEU Aviation, 83 of 123 EU fuel suppliers (67%) submitted required data to EASA (EASA Technical Report 2025). The compliance infrastructure is still new, and it’s the constraint on scale.
The Solution
Comprehensive verification, built around continuous satellite data.
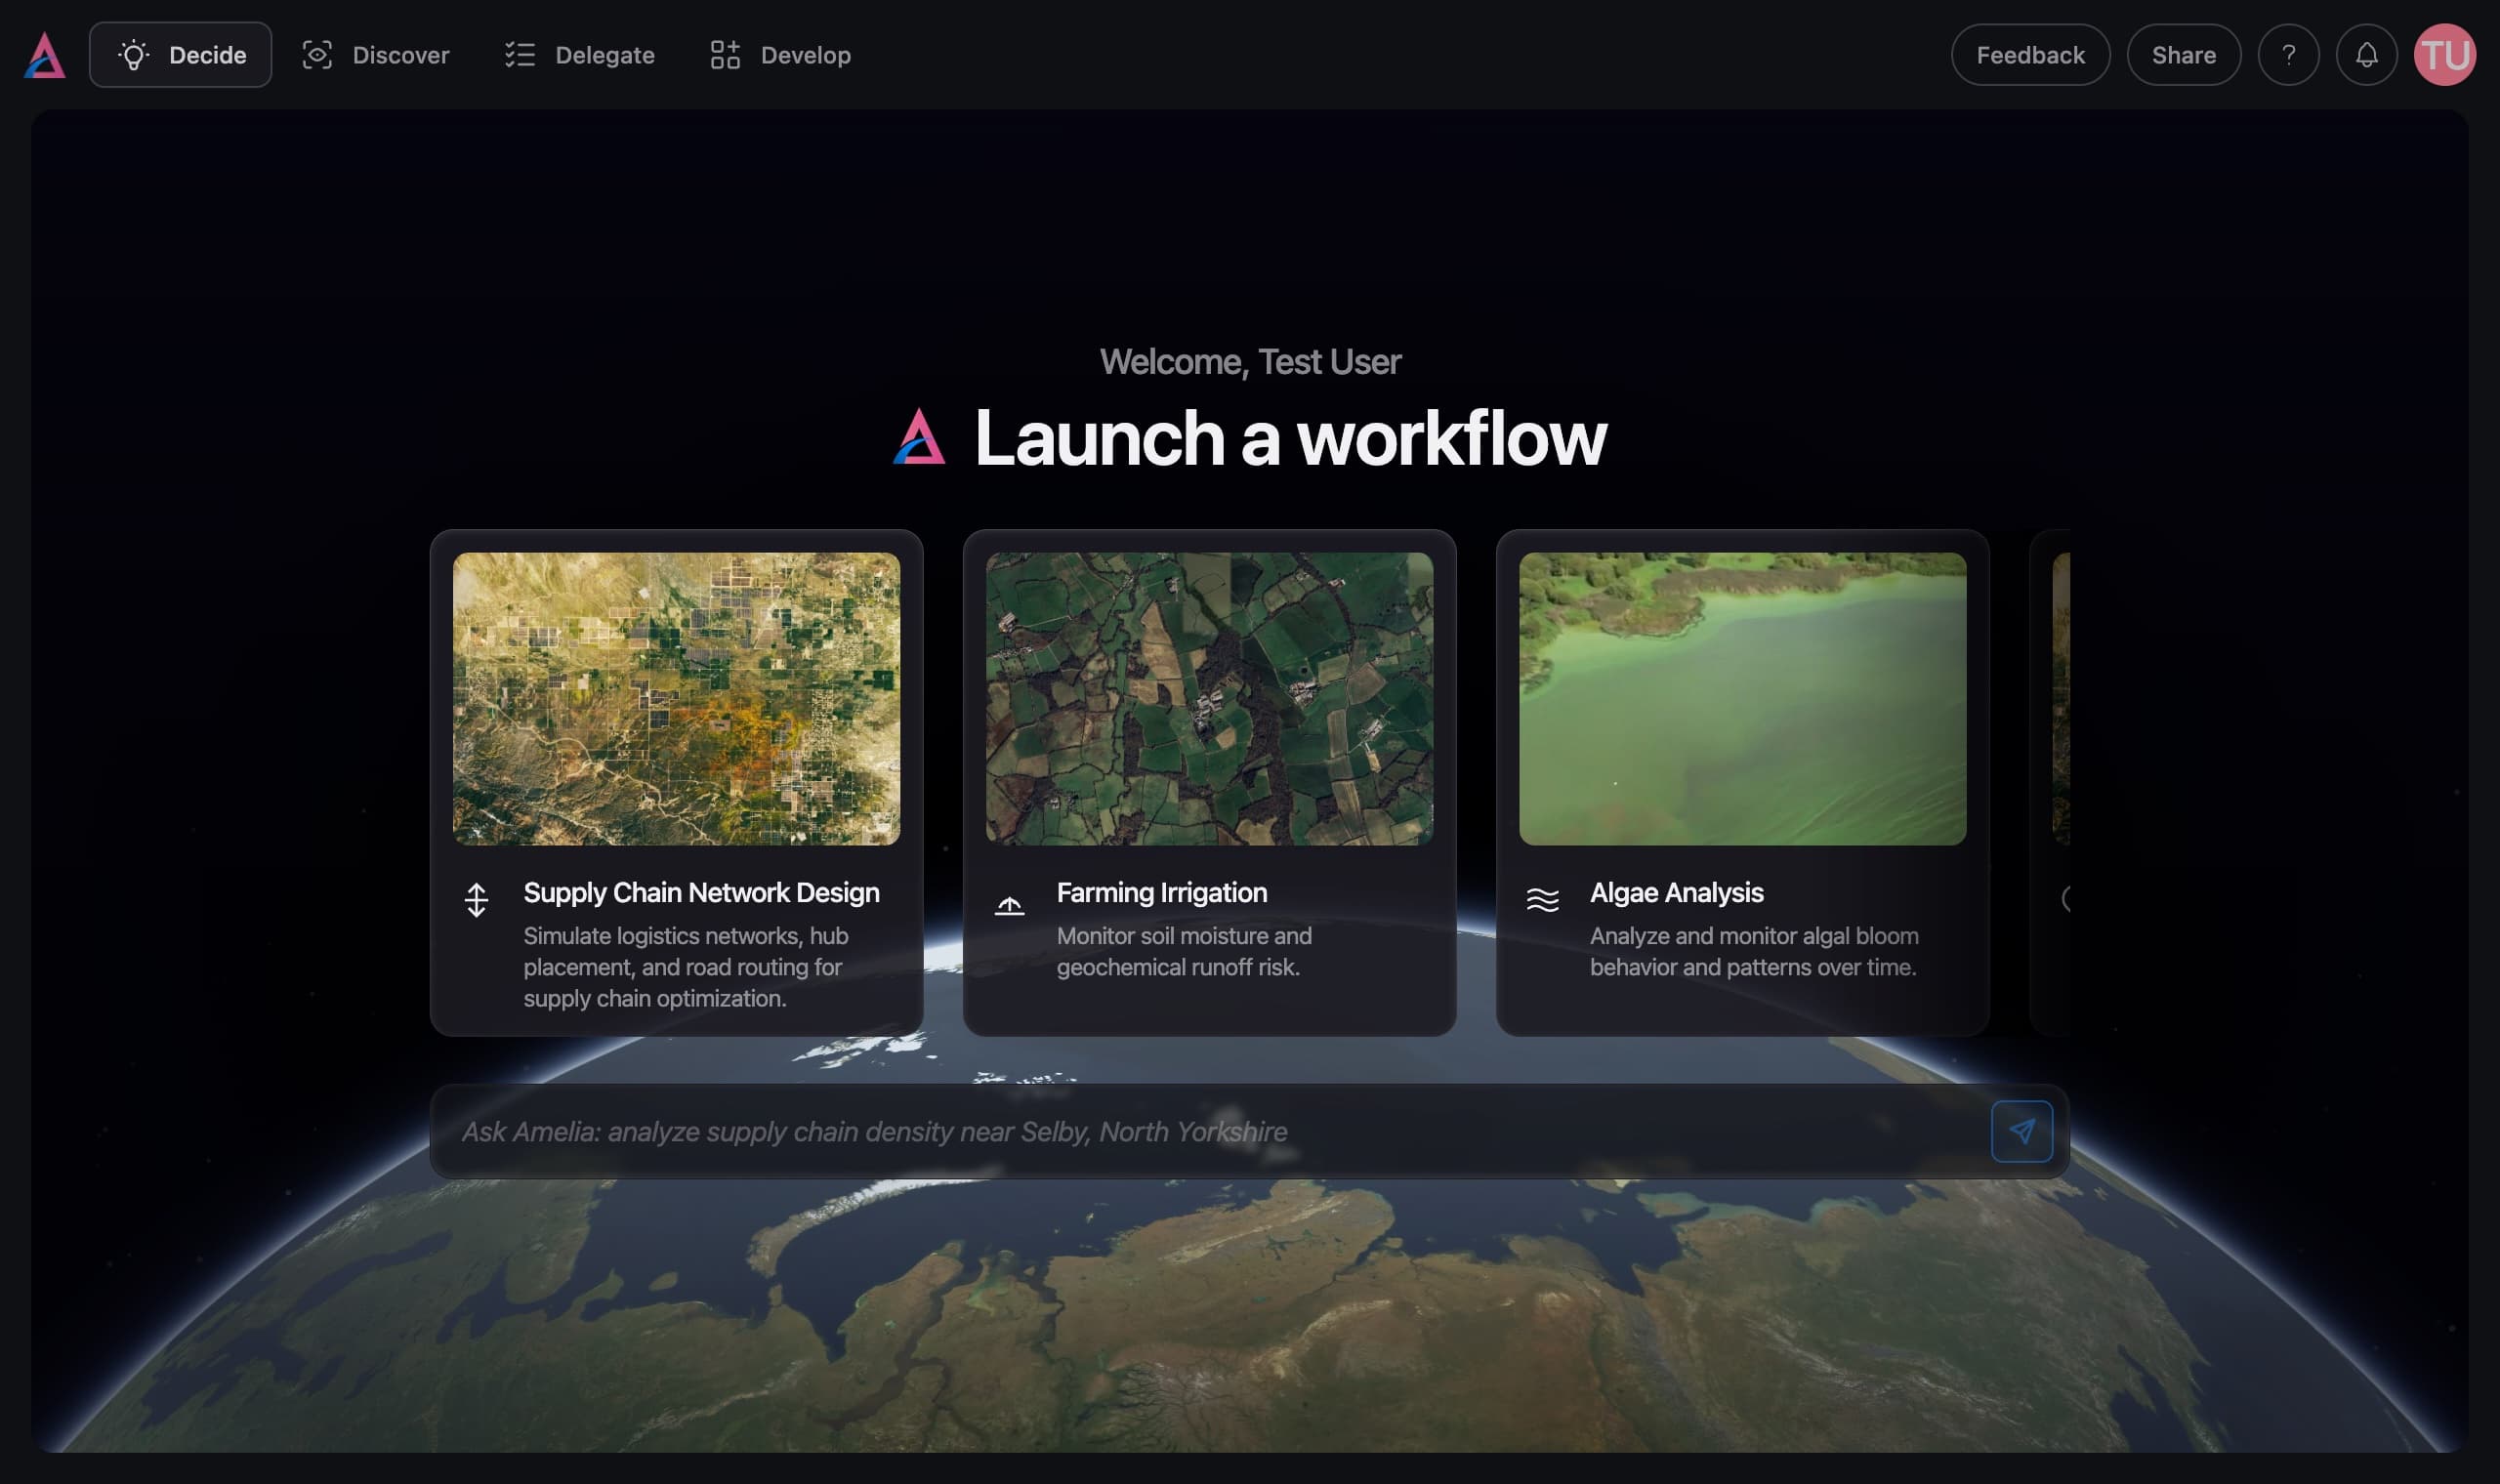
Amelia Space Technologies consolidates the evidence certifiers need into one place: satellite imagery, land-use datasets, supply-chain data, and custom models, mapped to the specific requirements of ISCC, RSB, and EU RED.
Amelia’s Planetary Intelligence Platform detects land-use change against the 2008 baseline, classifies residues and feedstock, and supports chain-of-custody from field to facility. The result is a data package shaped around what your auditor actually reviews. Developed with support from the UK Space Agency’s Climate Services programme.
Status quo → Amelia
Without Amelia
- Manual site visits across fragmented supply bases
- Paper-based audits stitched together by hand
- Compliance captured as a one-time snapshot
With Amelia’s Planetary Intelligence Platform
- Satellite verification at individual-parcel resolution
- One auditor-ready evidence package per site
- Continuous monthly updates, not a one-shot audit
Evidence you can see
What continuous satellite monitoring actually looks like.
Three real examples of the evidence Amelia’s platform produces, each one mapped to what ISCC or RSB already requires.
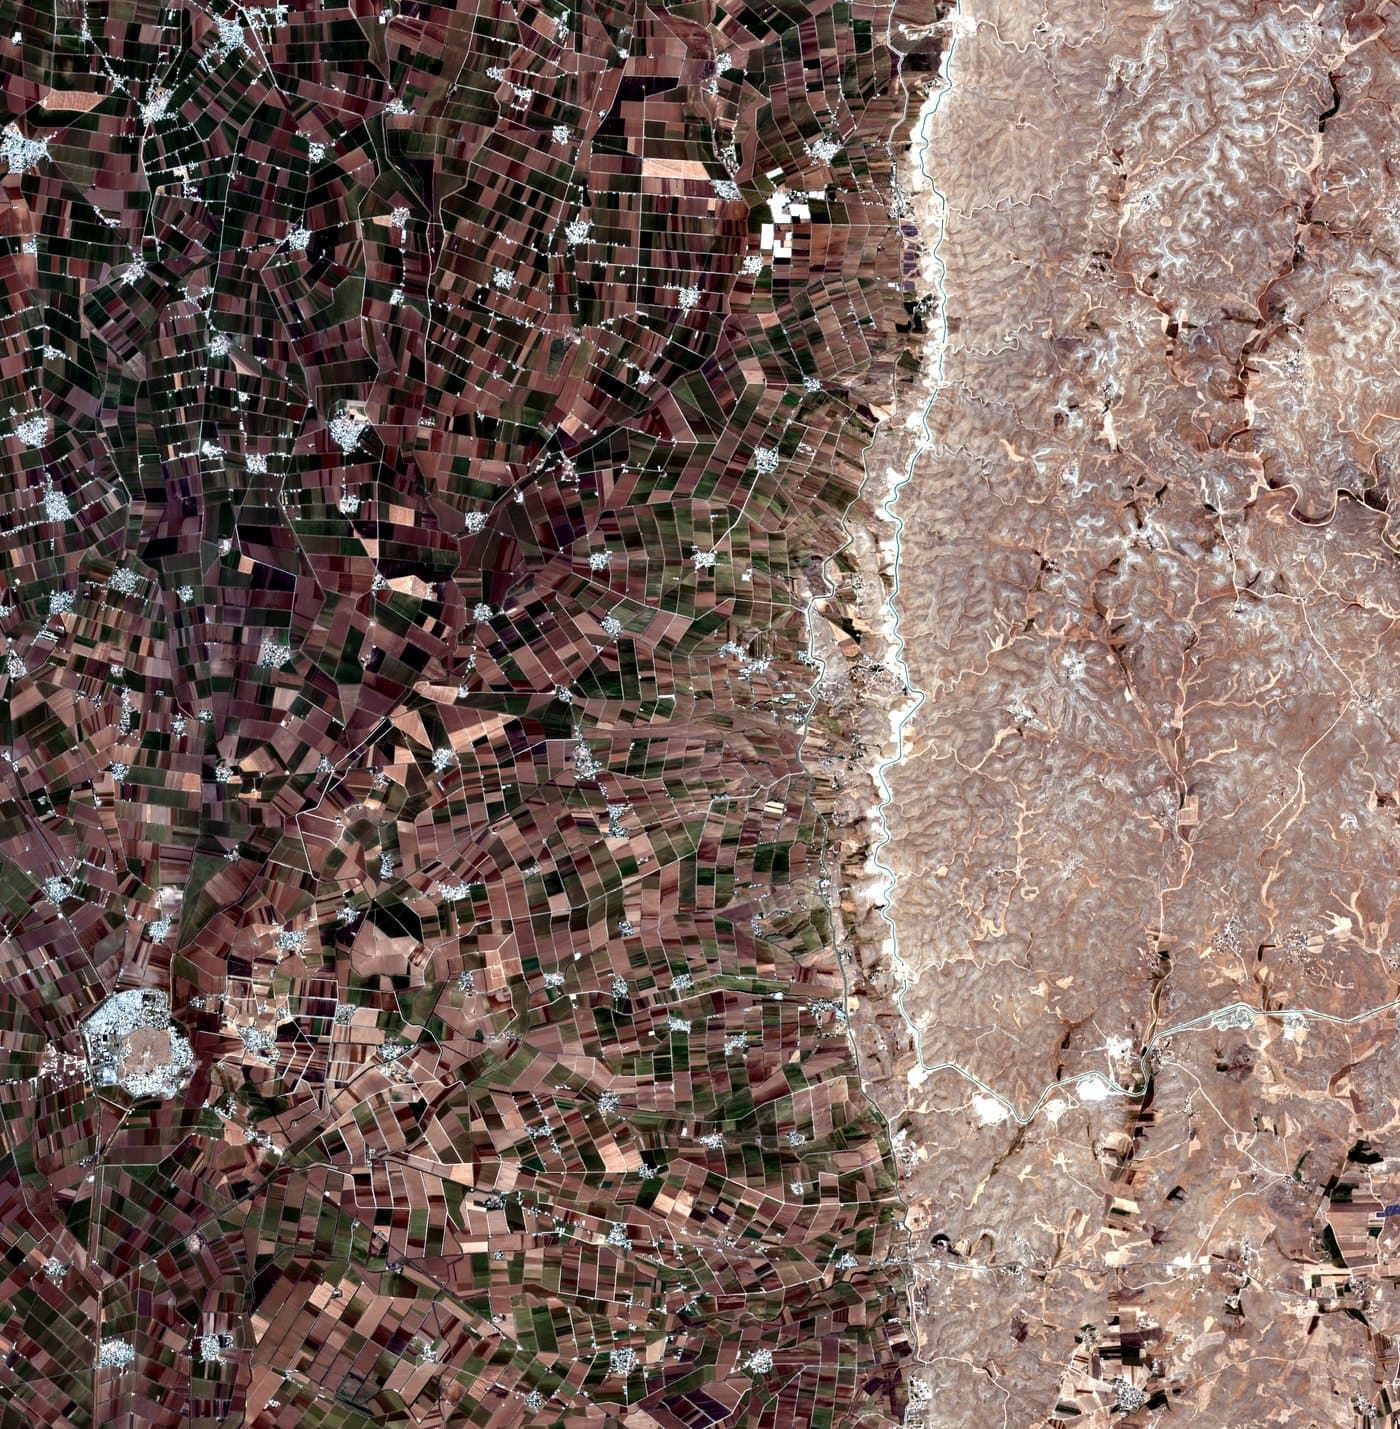
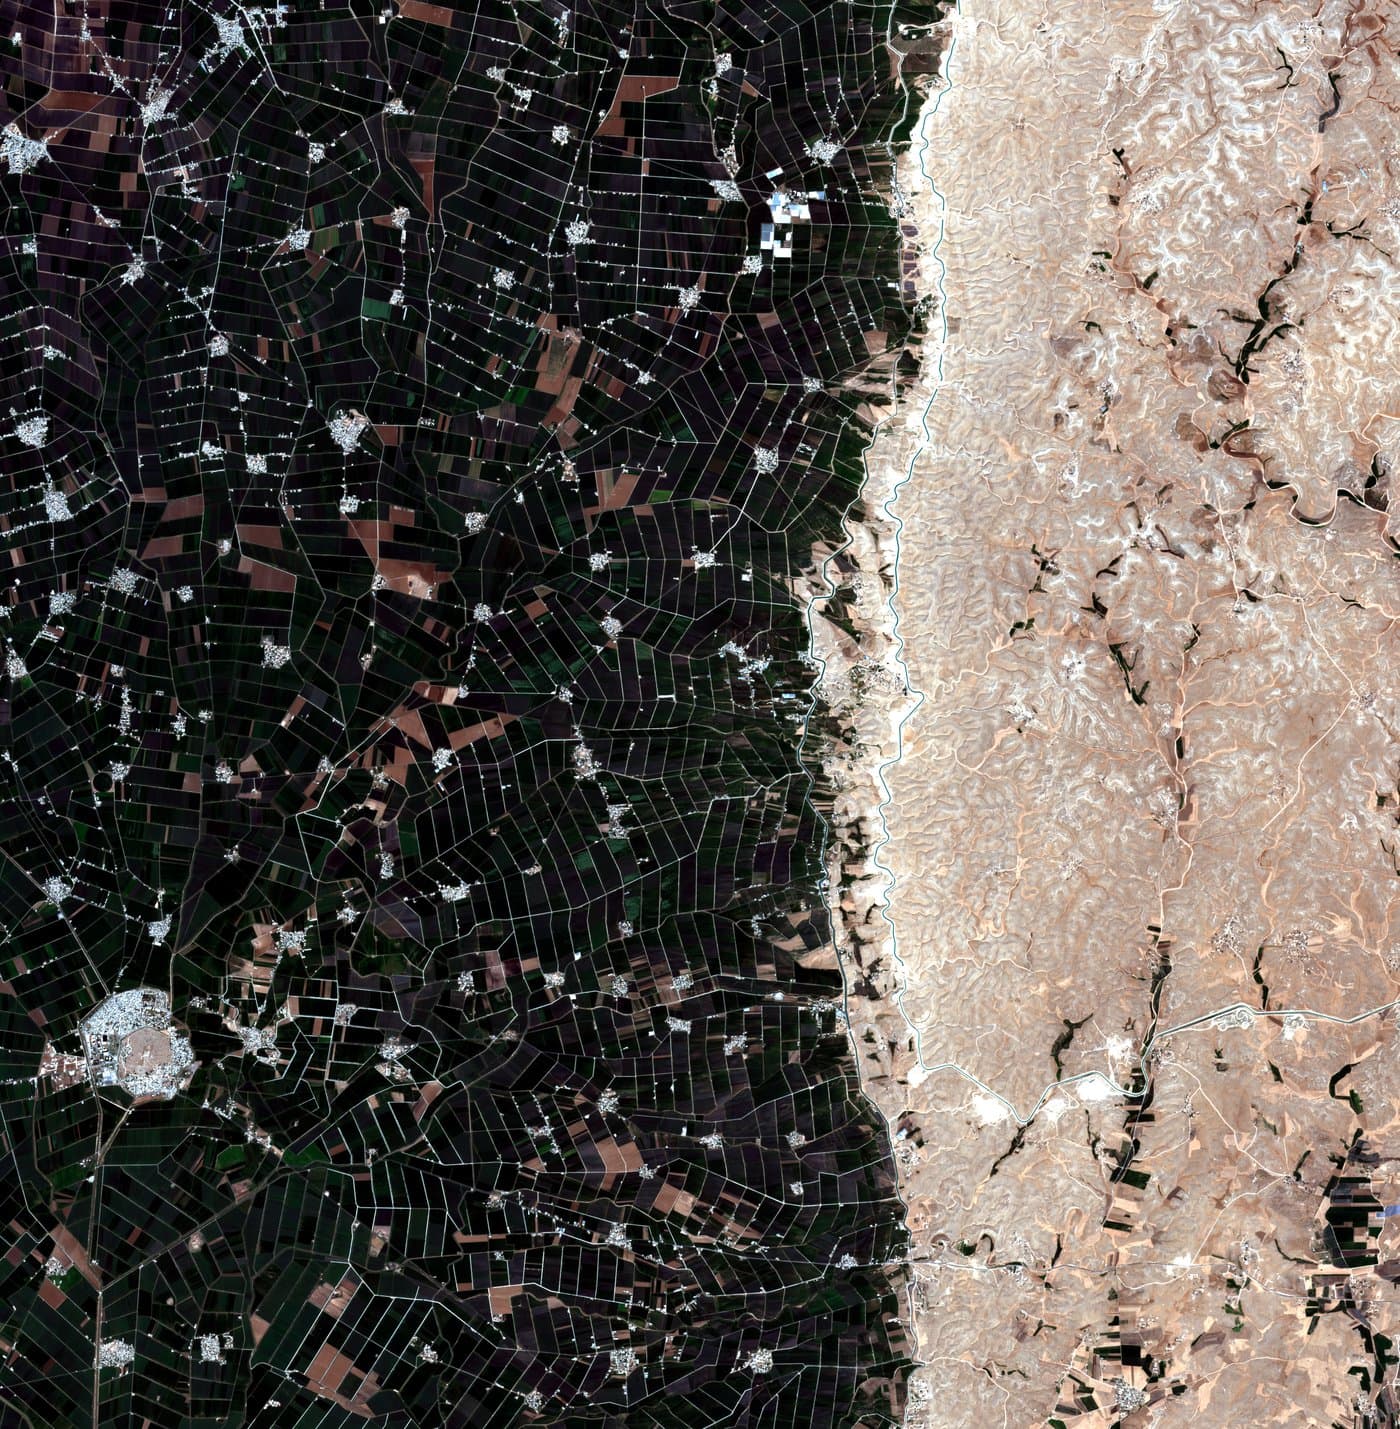
Land-use verification
Forest cleared. Feedstock disqualified.
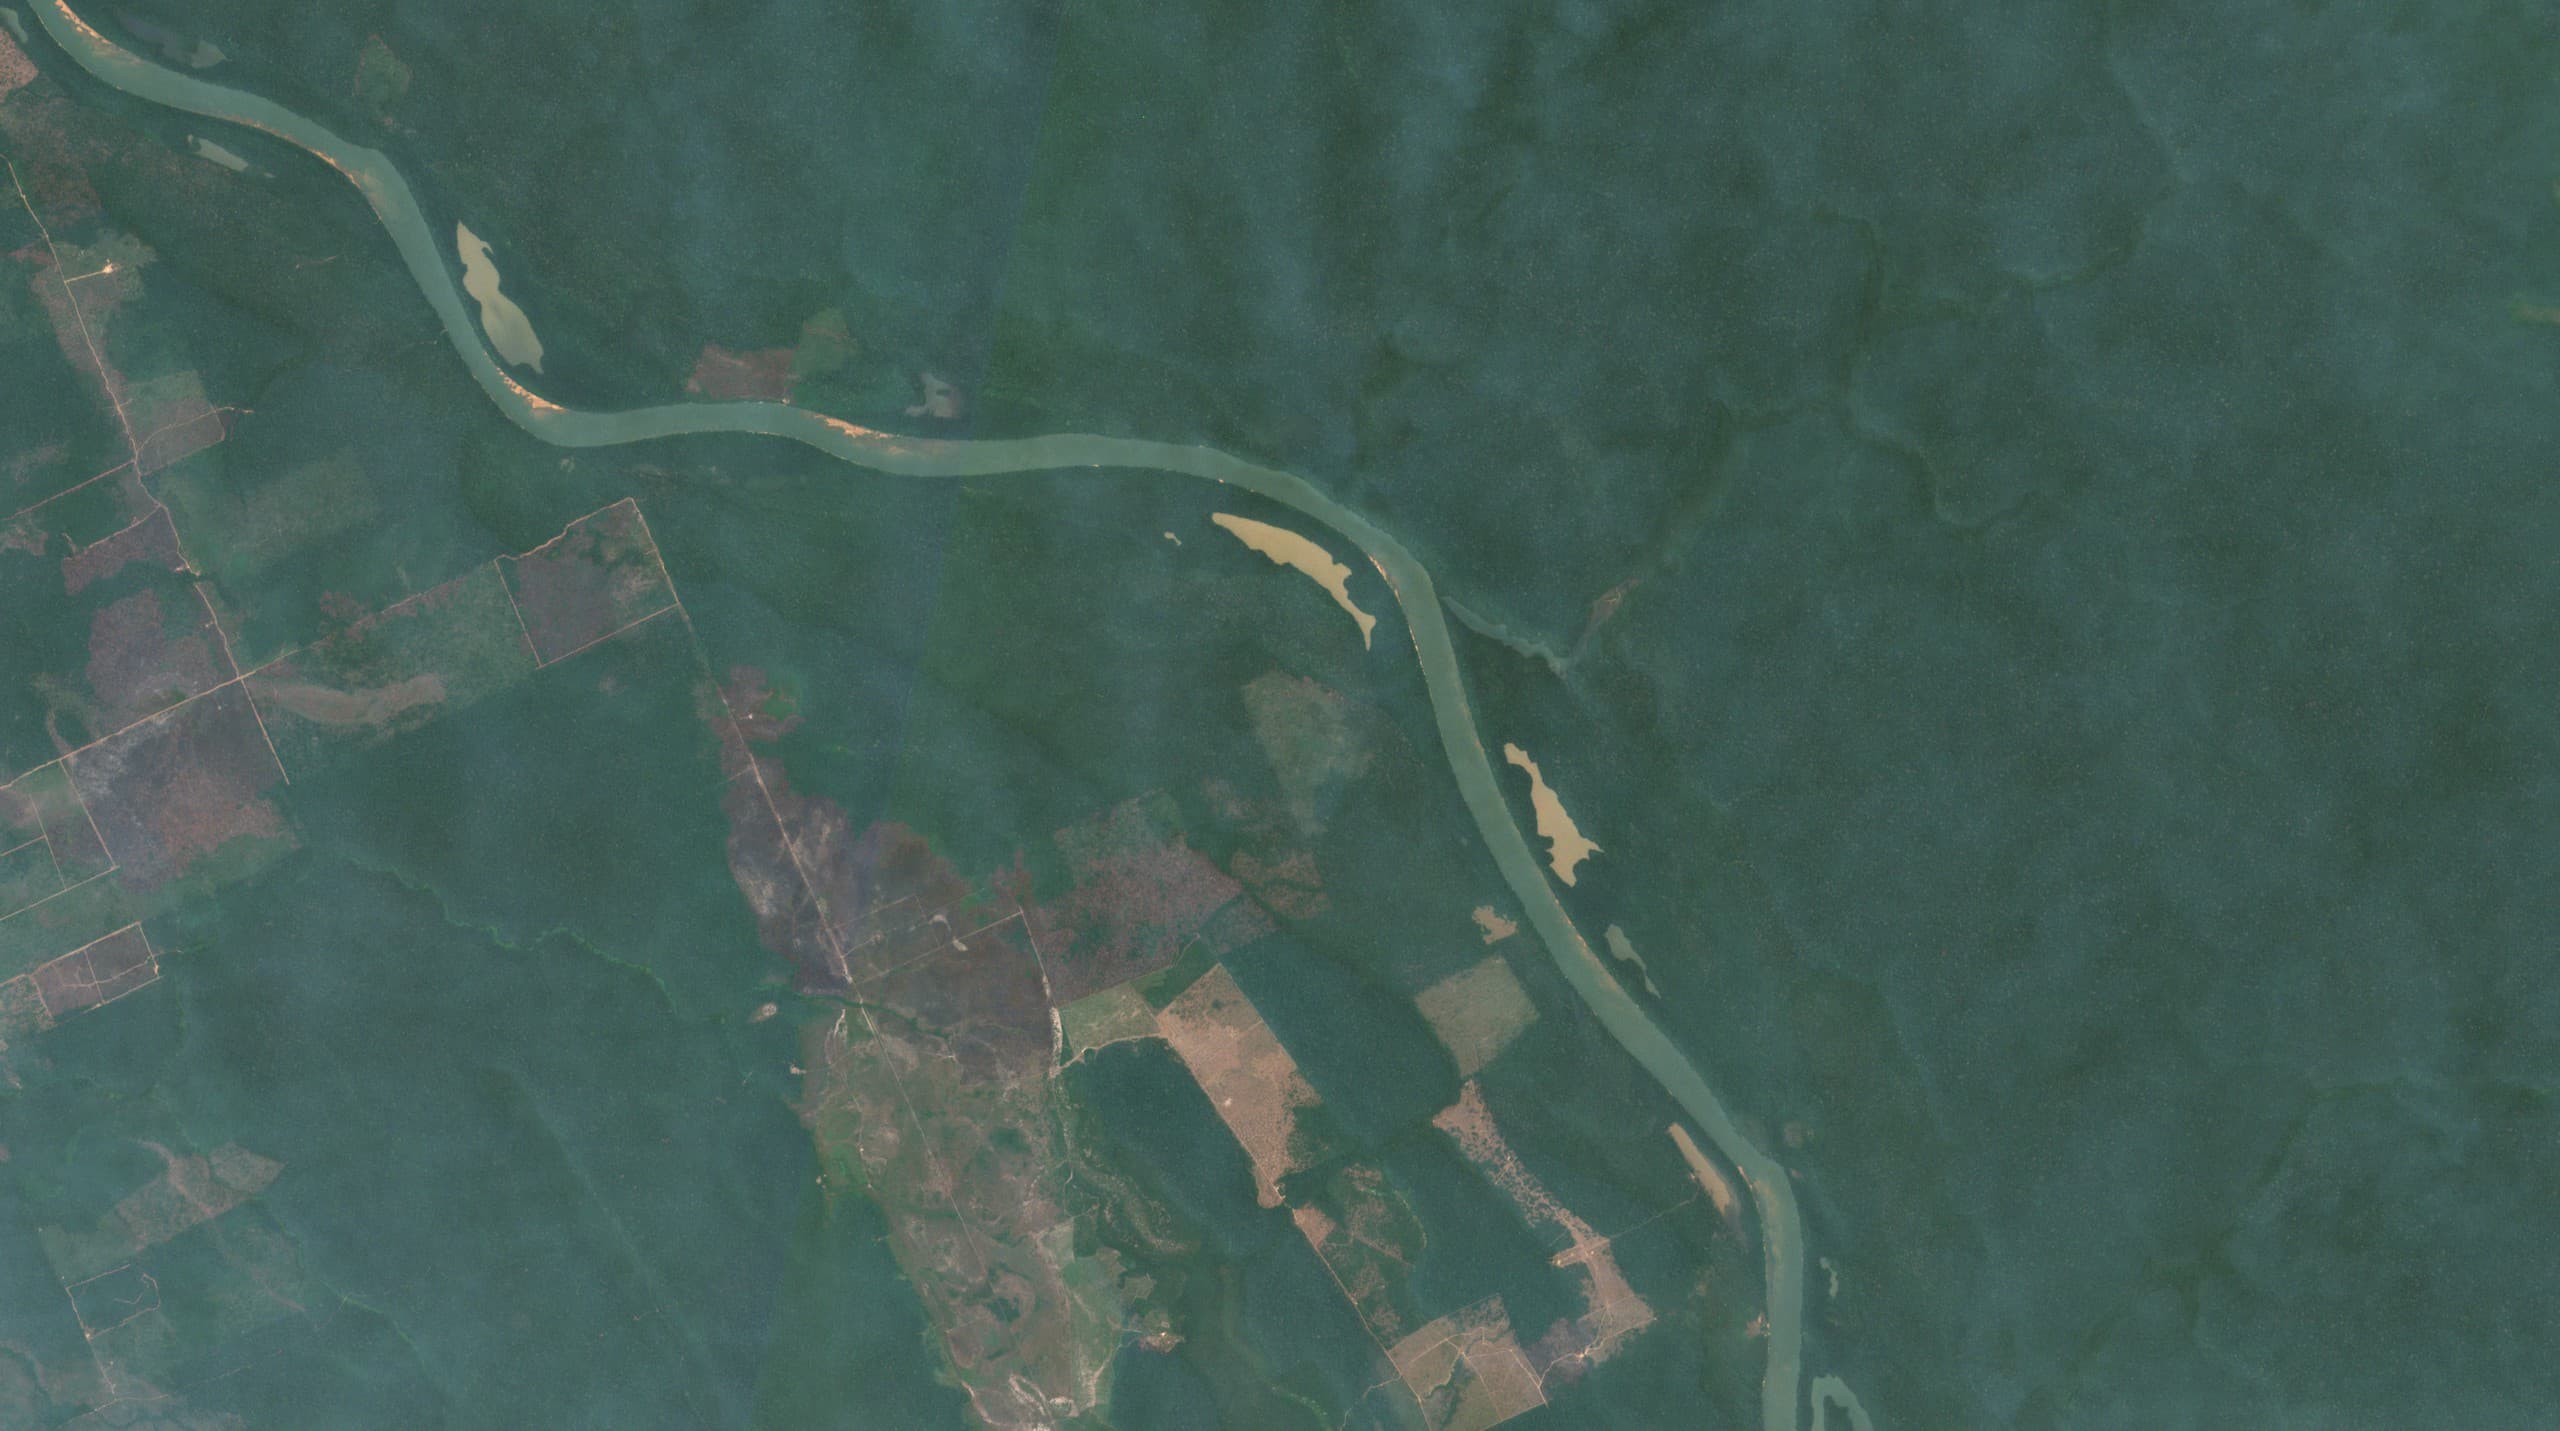
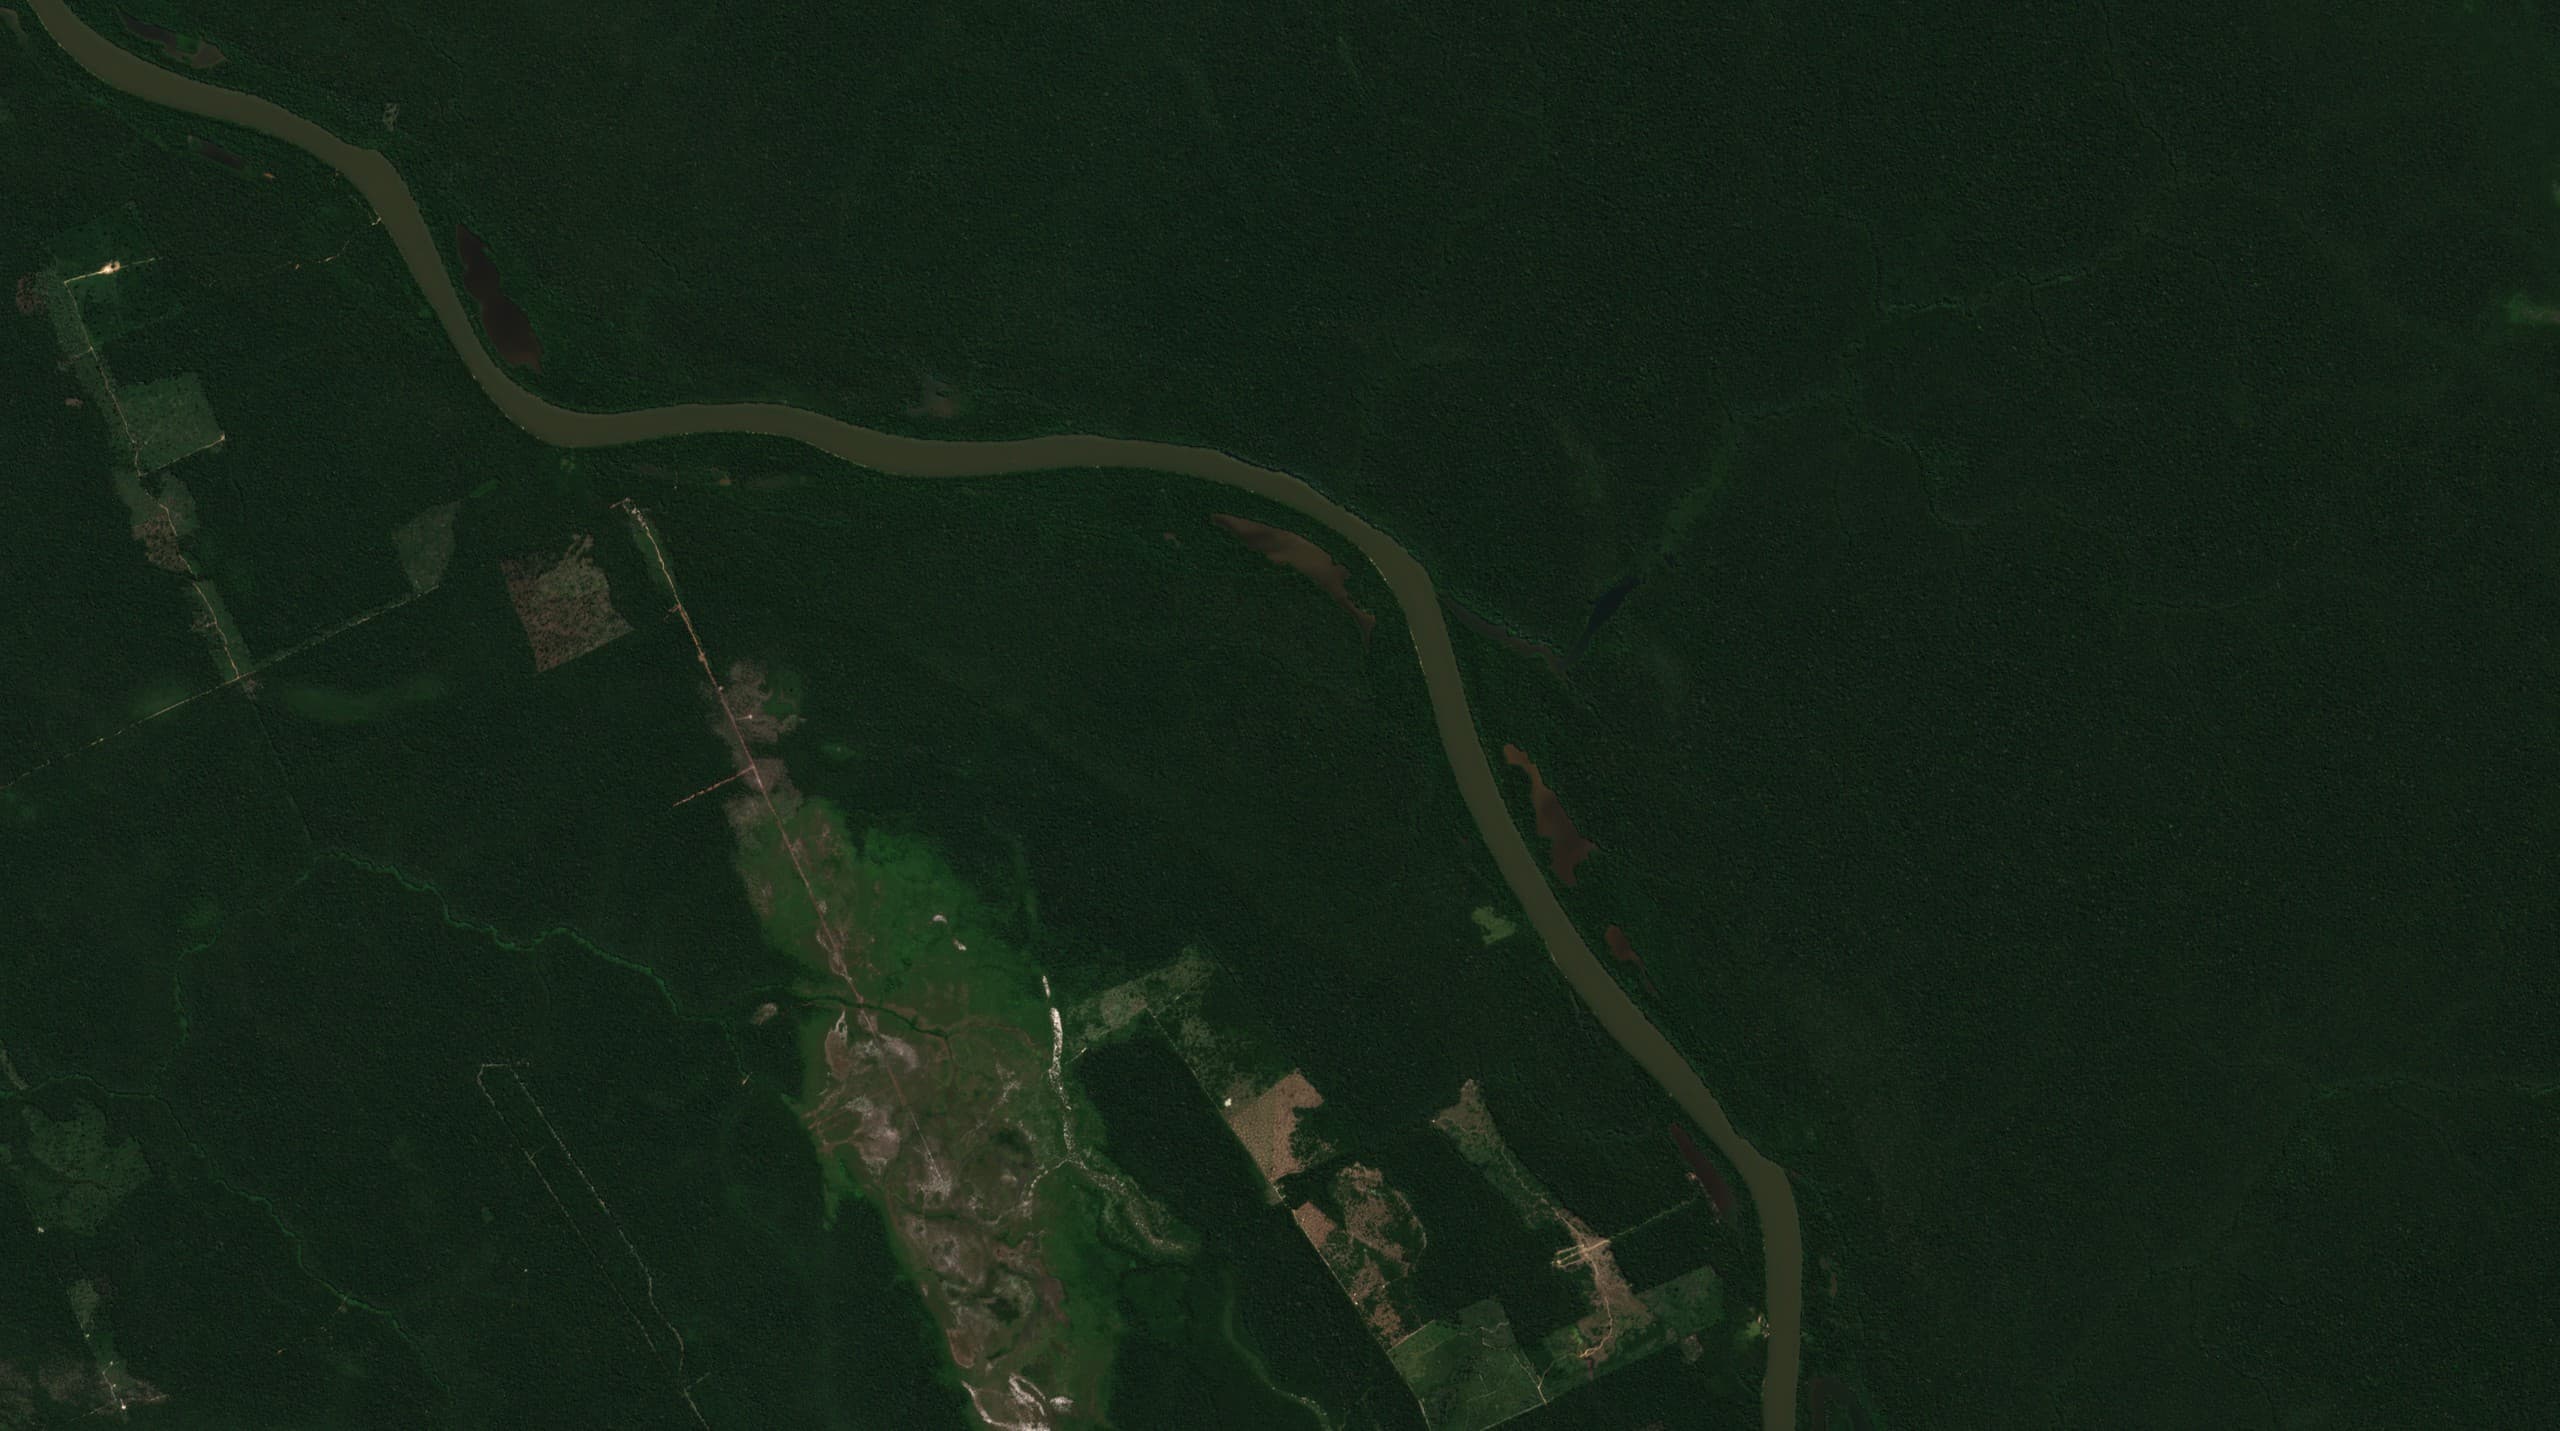
Drag the divider to reveal the change. Under ISCC EU 202, SAF feedstock grown on land converted from forest after 1 January 2008 fails certification, regardless of crop, producer, or pathway. This is what that disqualifying pattern looks like from space.
Same coordinates, 27 months apart, from a continuously updated record. The compliance signal is the change itself, caught before filing, not after.
Drag to reveal
Seasonal monitoring
One site, across four seasons.
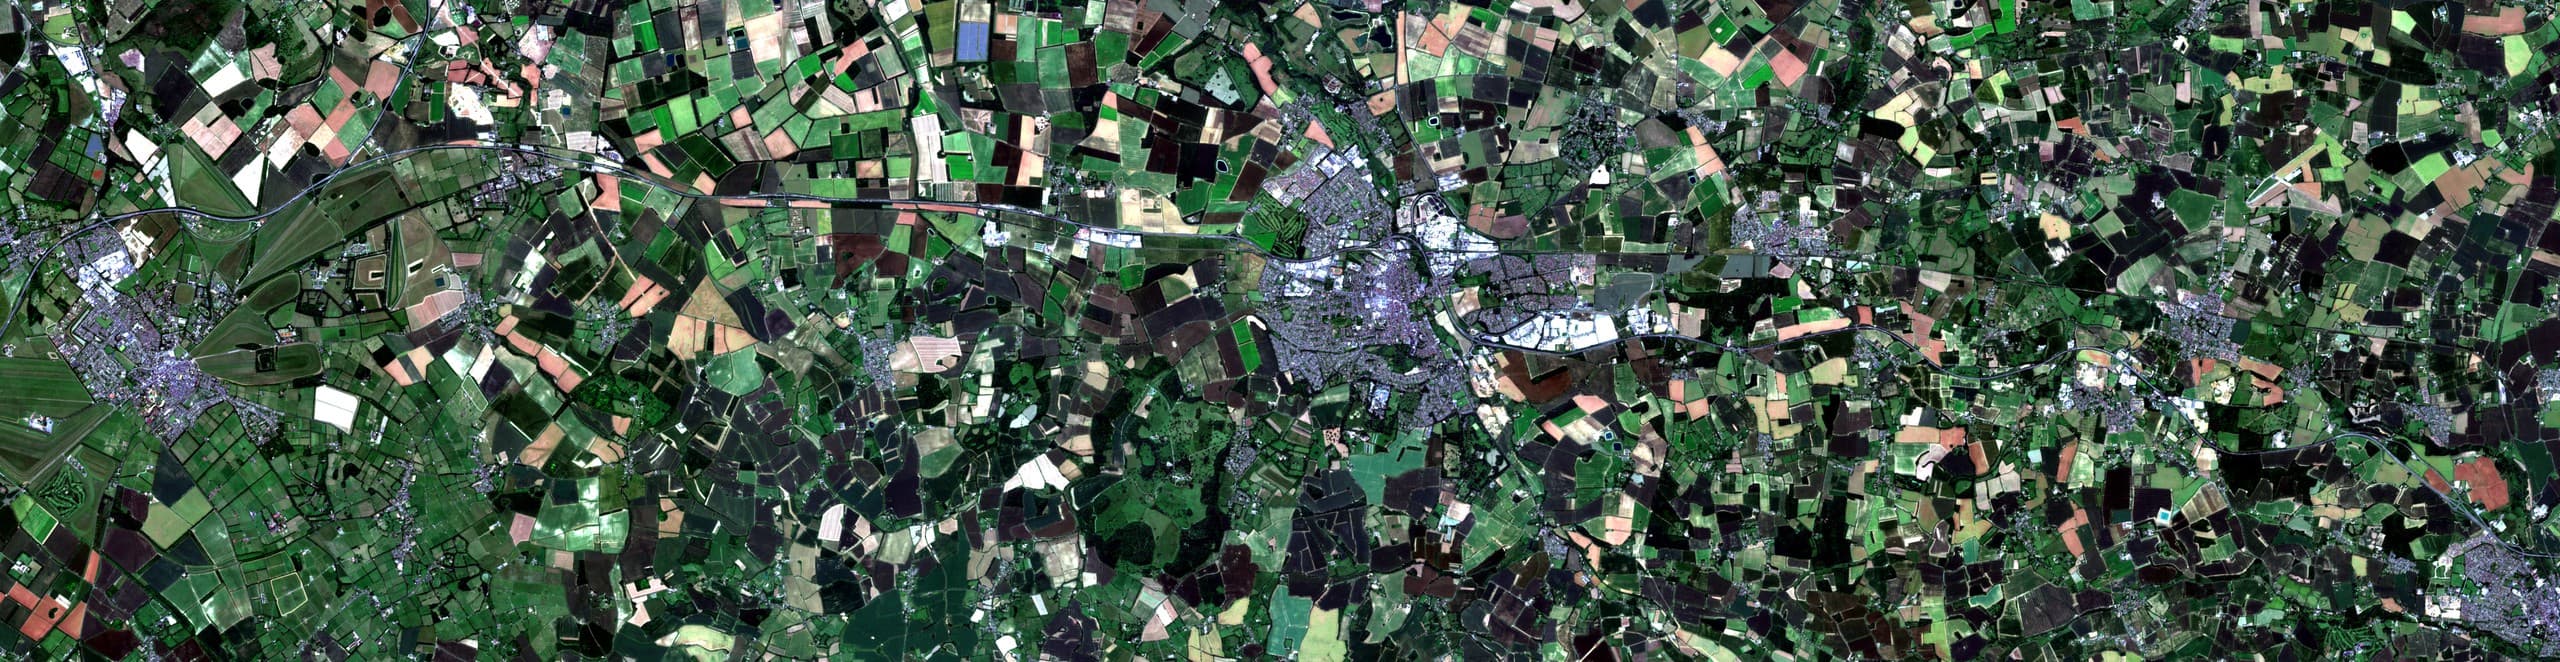
A site in the irrigated plains of southeast Turkey, tracked at the same coordinates across four seasons. The cycle of green, bare, and dormant fields is the shape of feedstock availability: what a SAF producer needs to see before locking down supply.
Apr 2024
Early spring
Jun 2024
Mid summer
Sep 2024
Early autumn
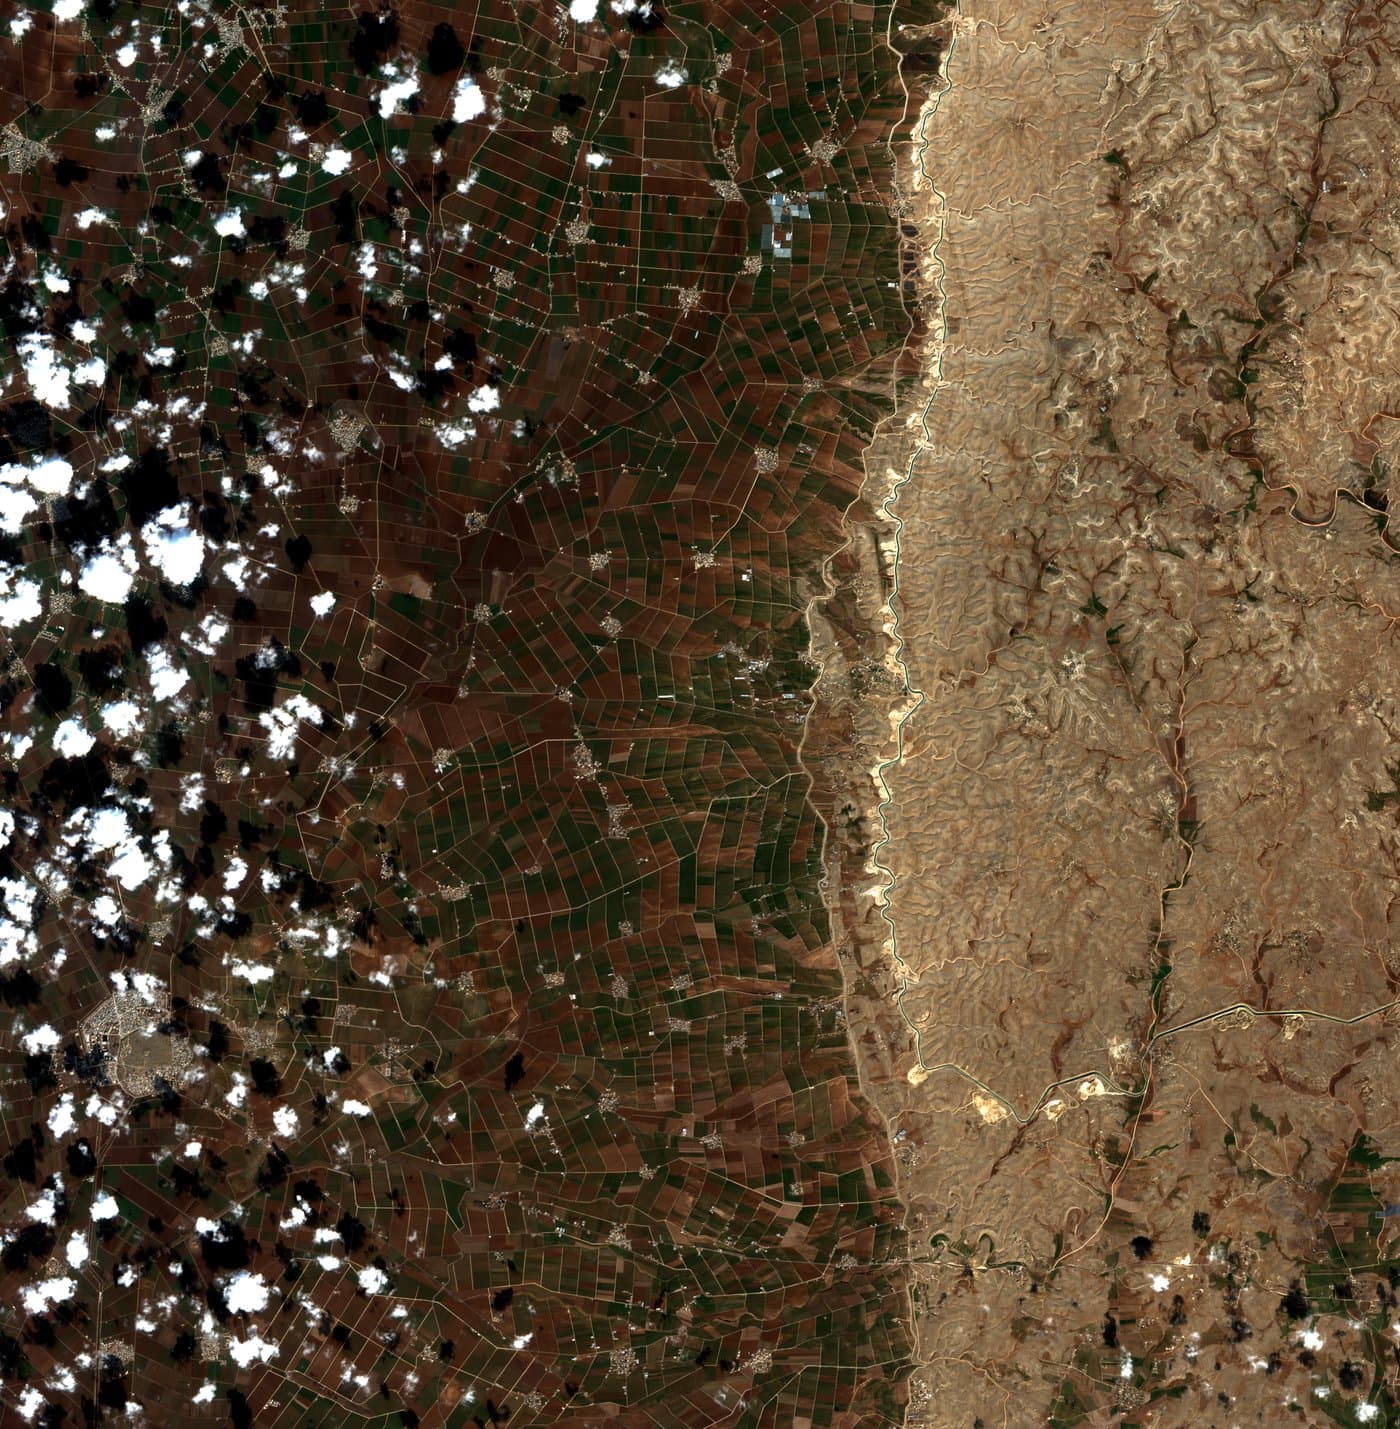
Feb 2025
Late winter
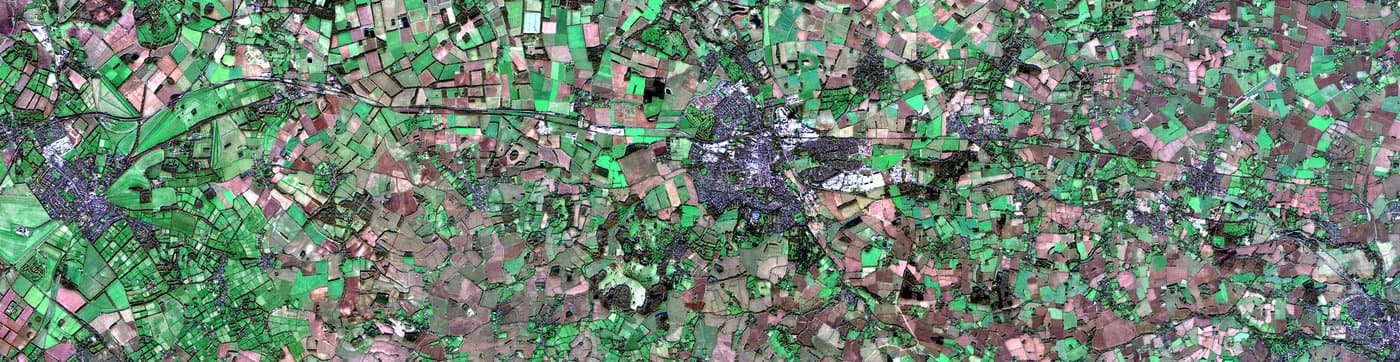
Supply chain tracking
A supply region, tracked through the year.
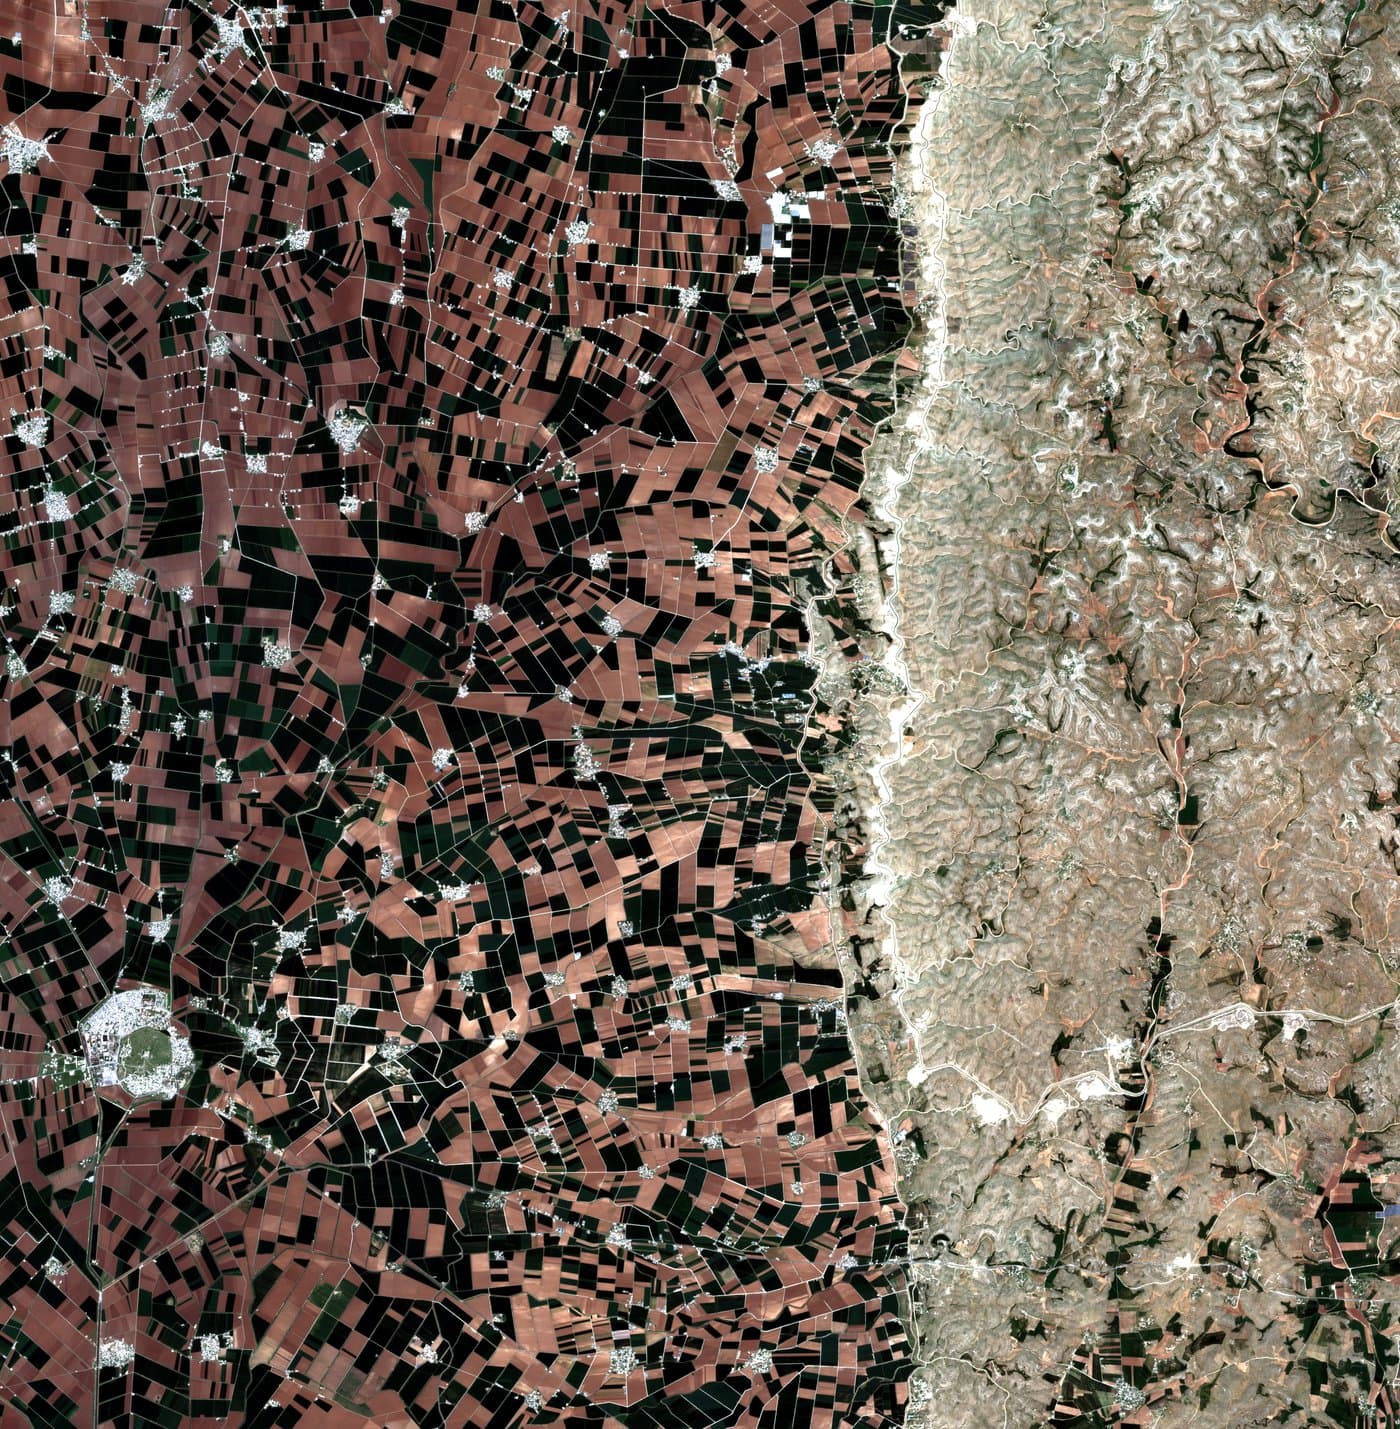
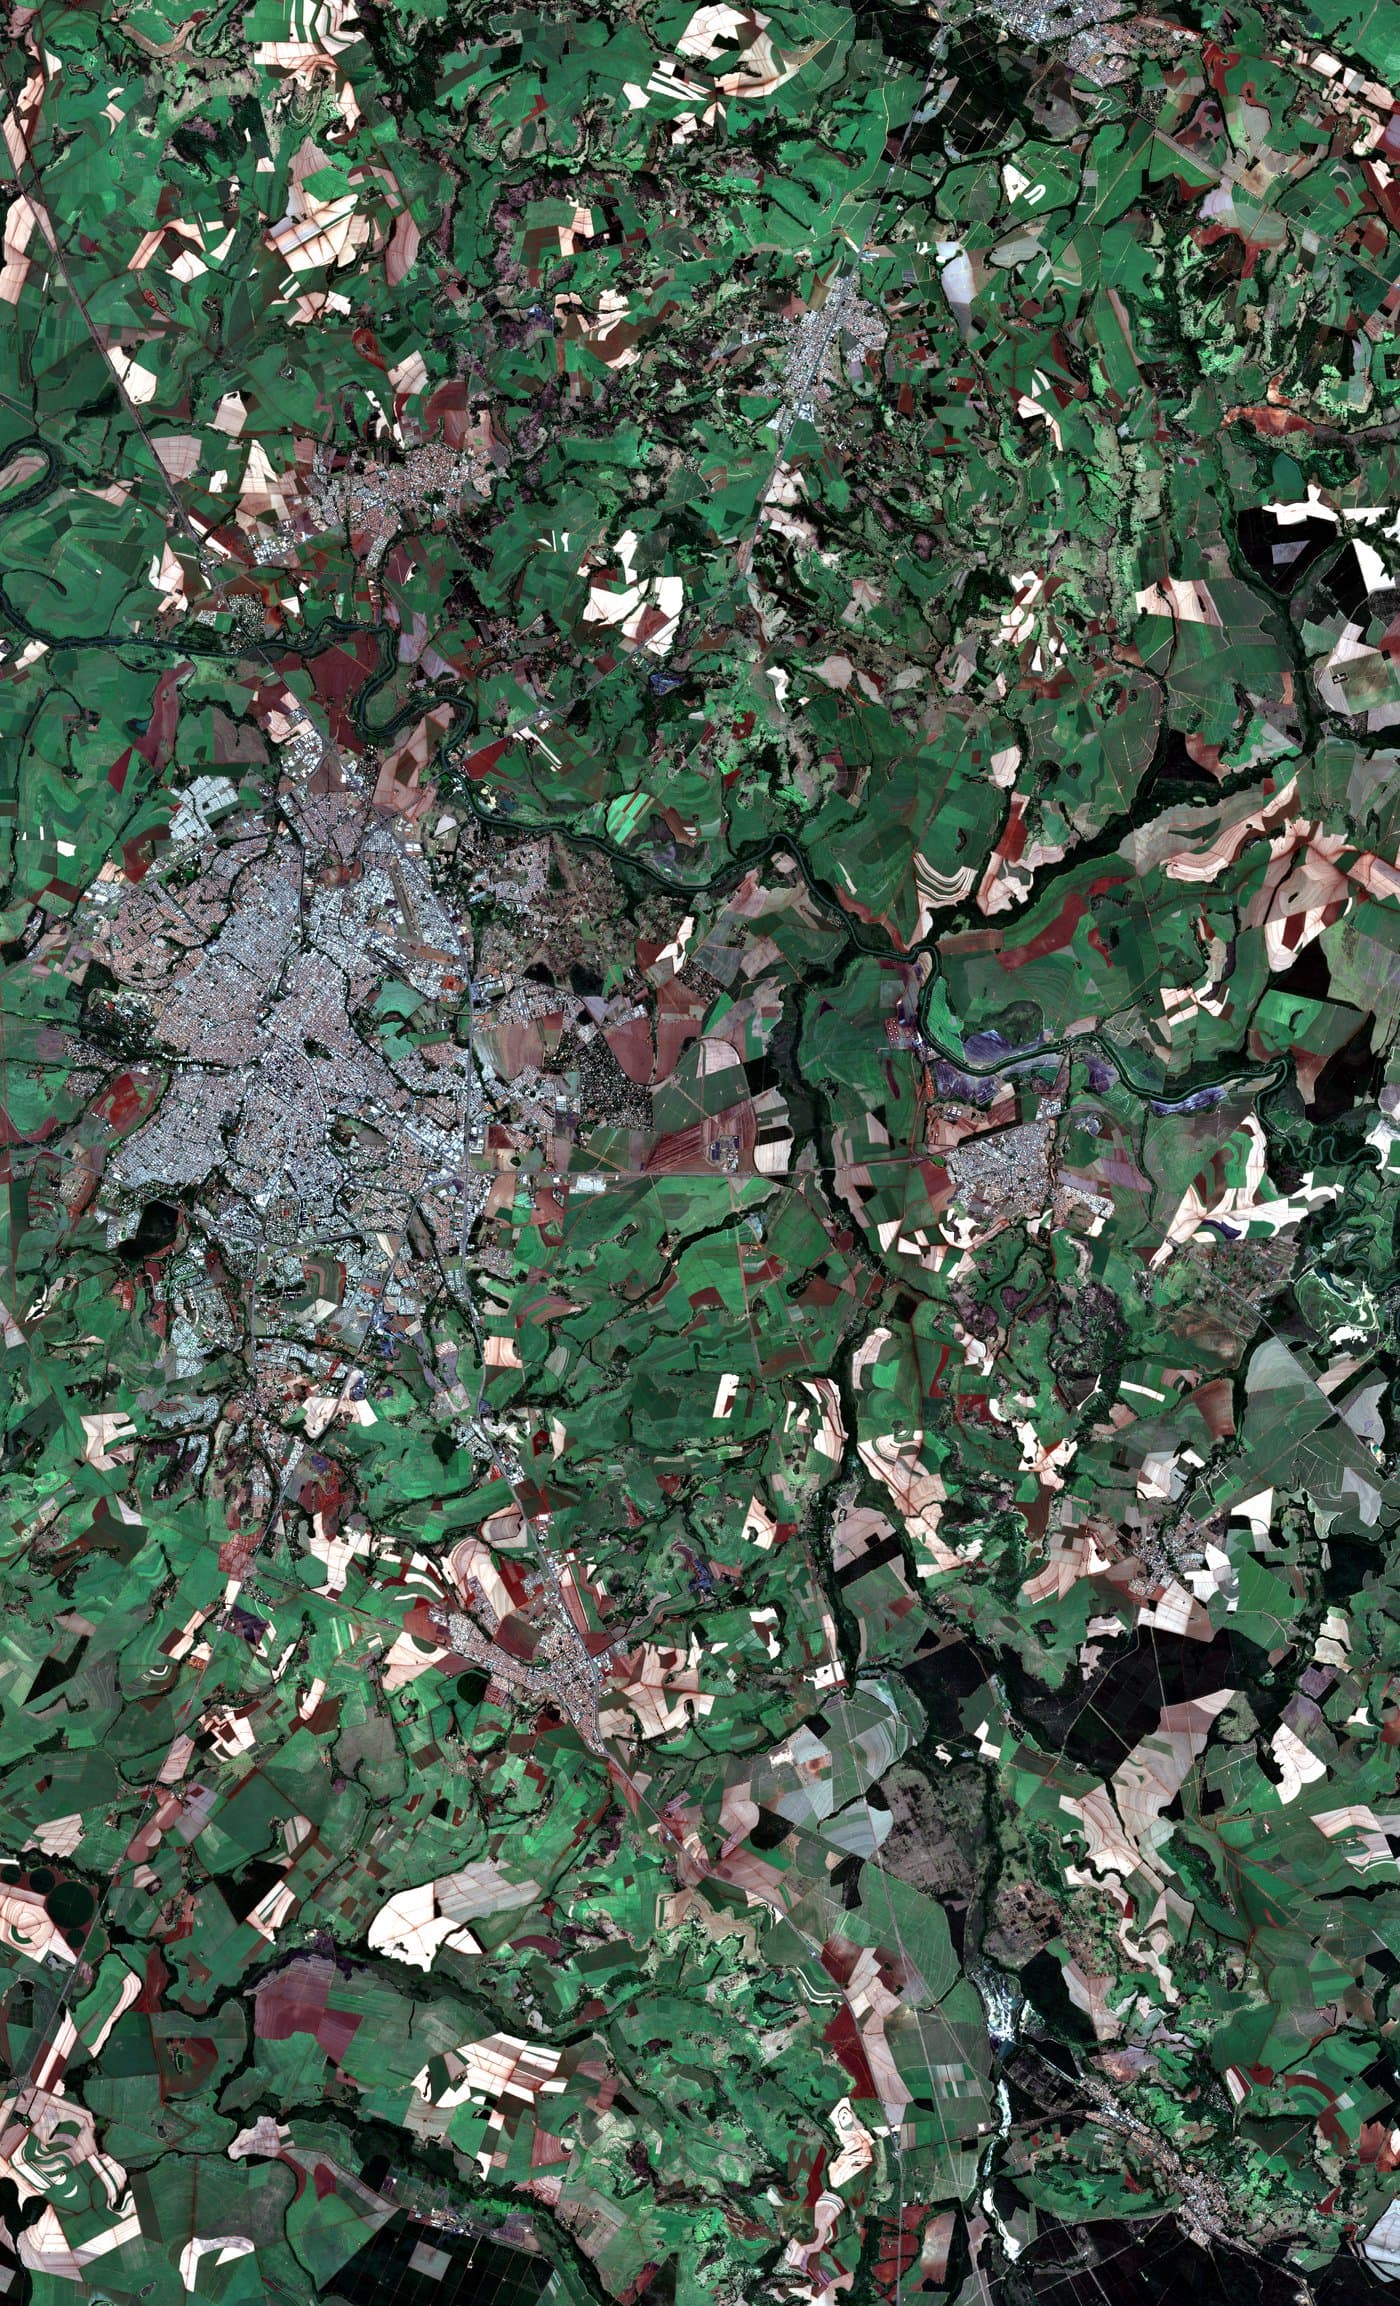
São Paulo: the heart of Brazil’s sugarcane country and a major feedstock region for ethanol-to-jet SAF. The same area, across four seasons, shifts from wet-season green to dry-season mosaics of cleared and standing fields: the regional pattern a producer reads before locking down volumes.
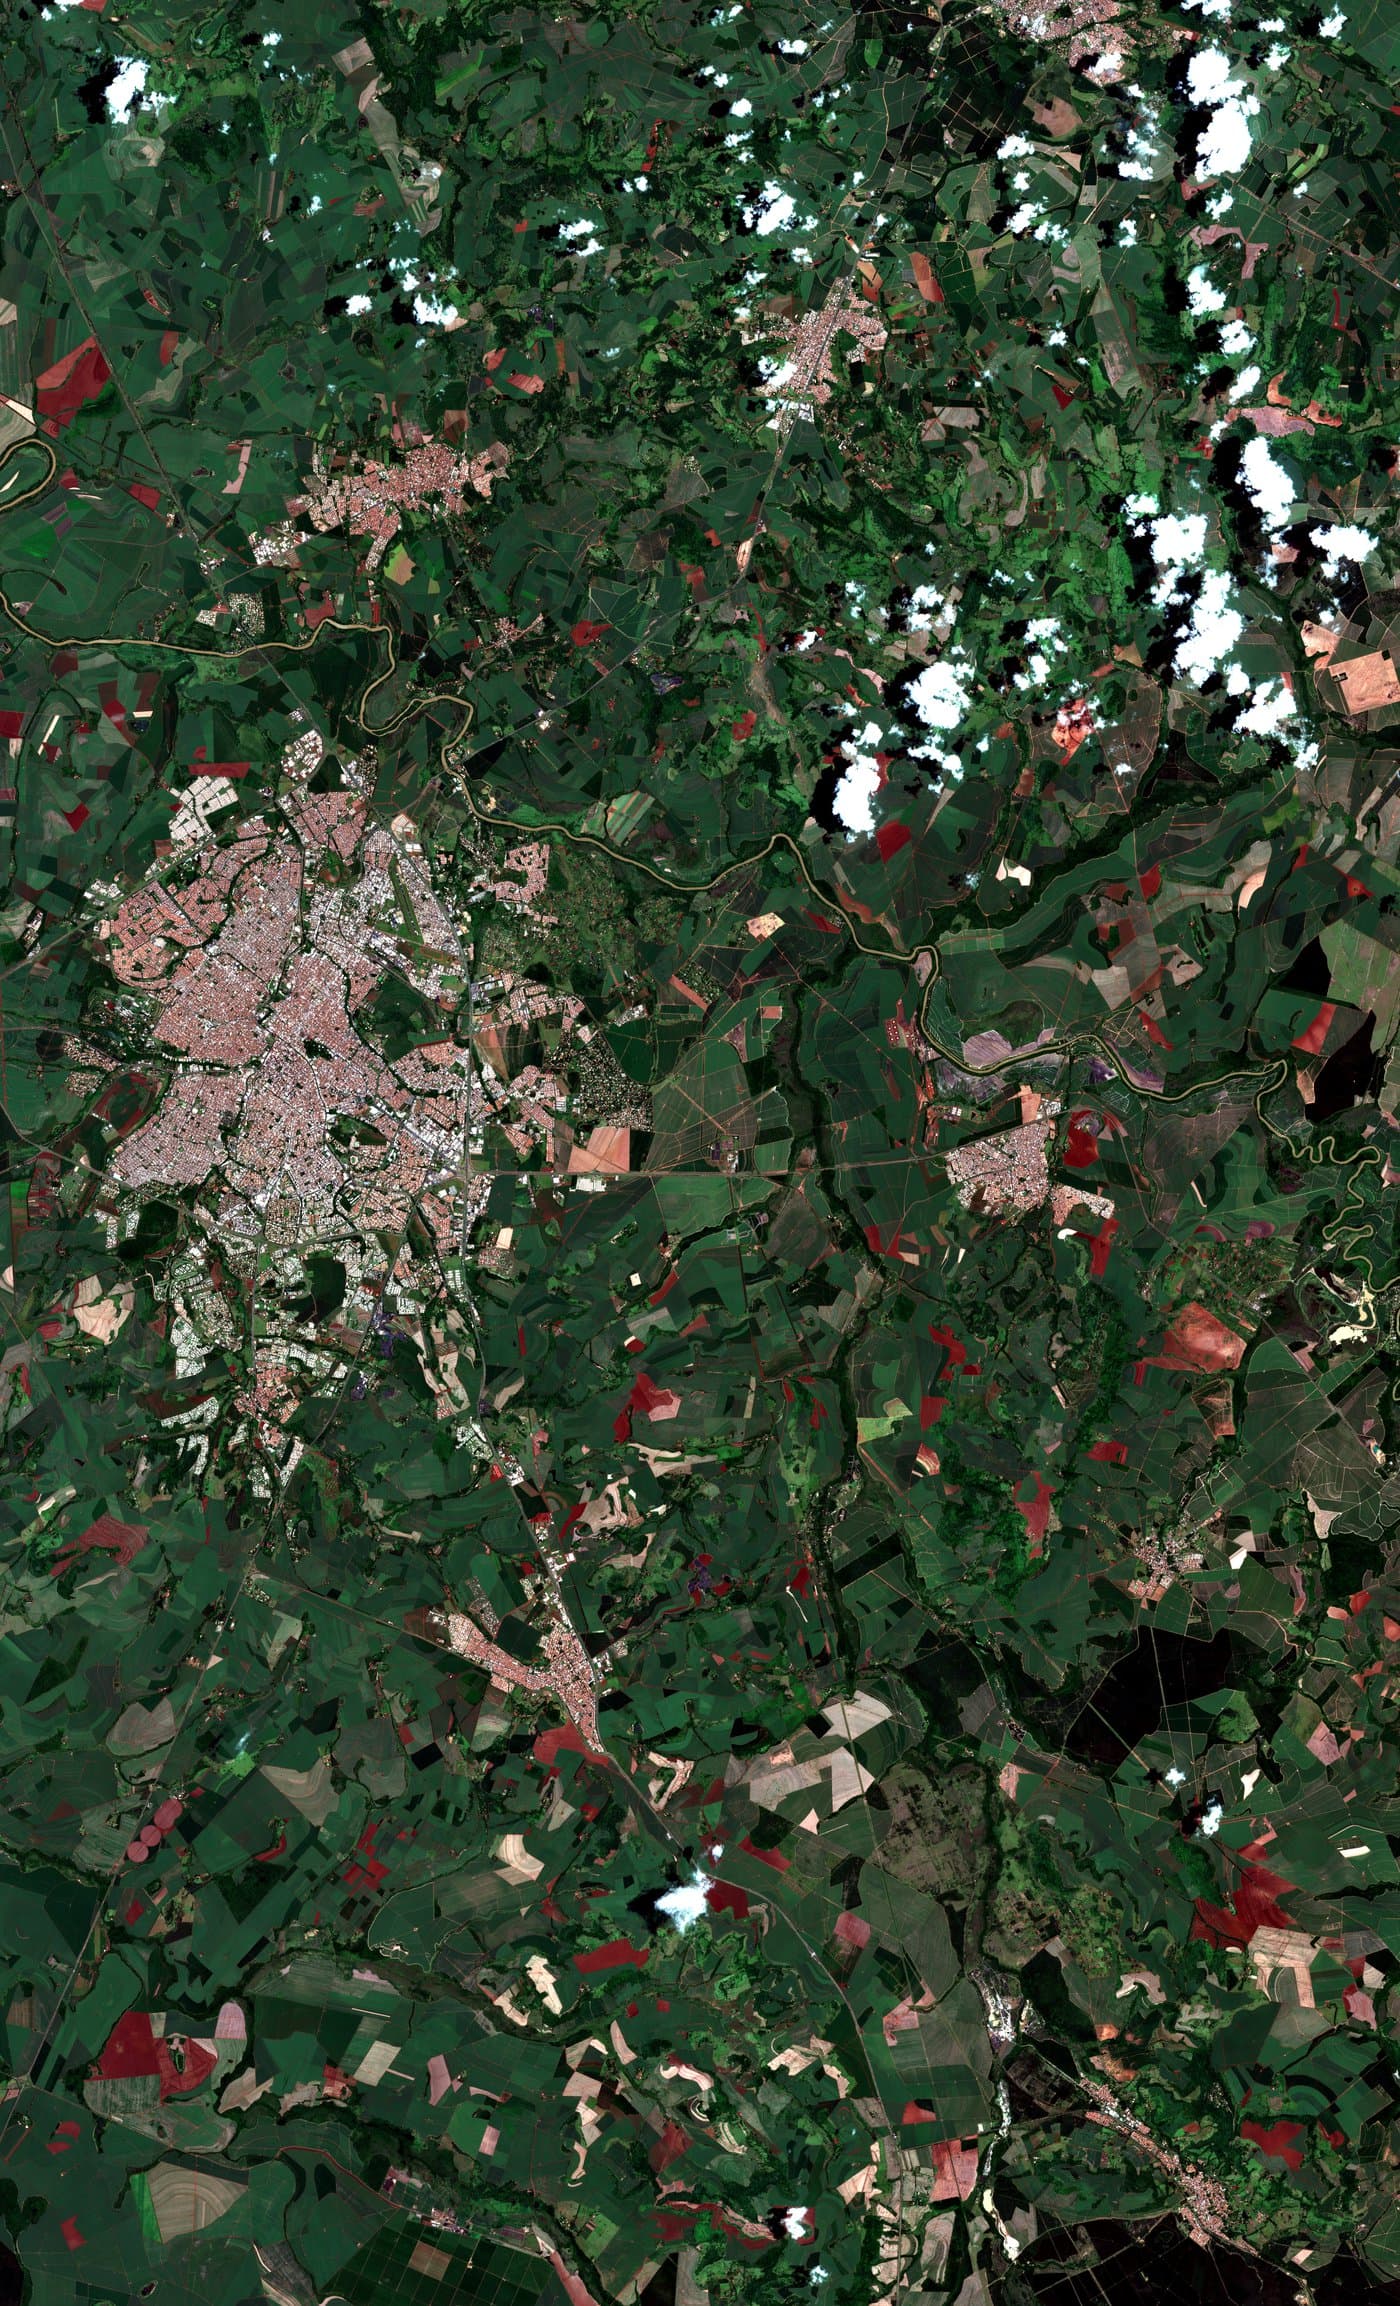
Jan 2024
Wet season
Jun 2024
Early dry season
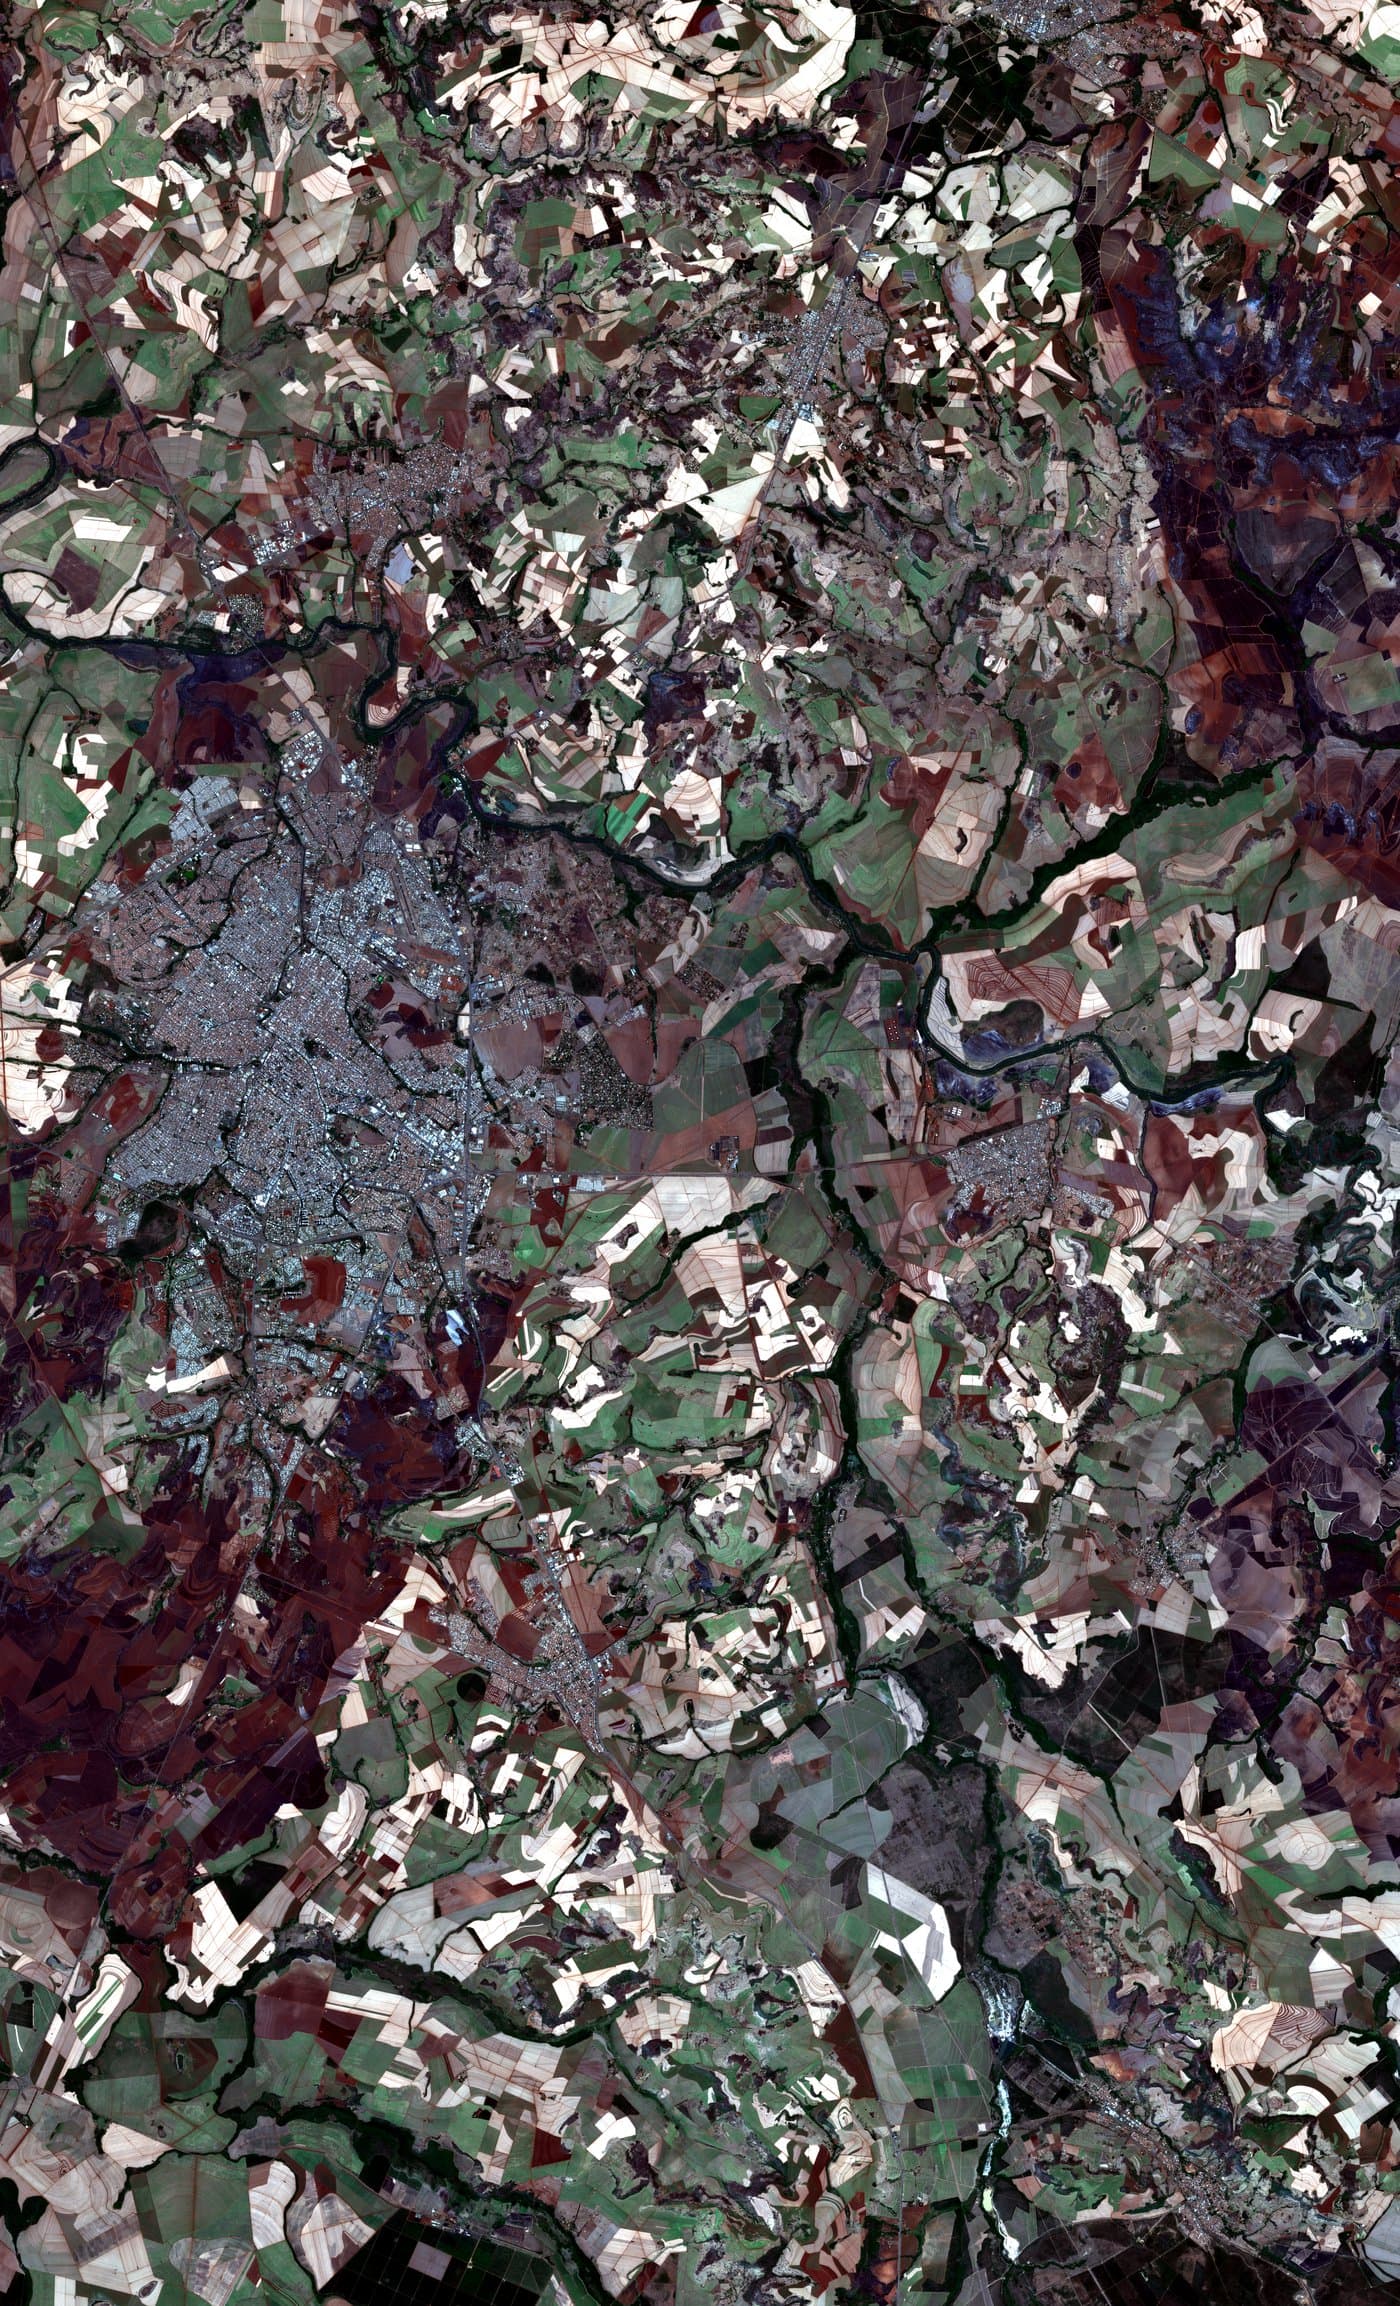
Aug 2024
Mid dry season
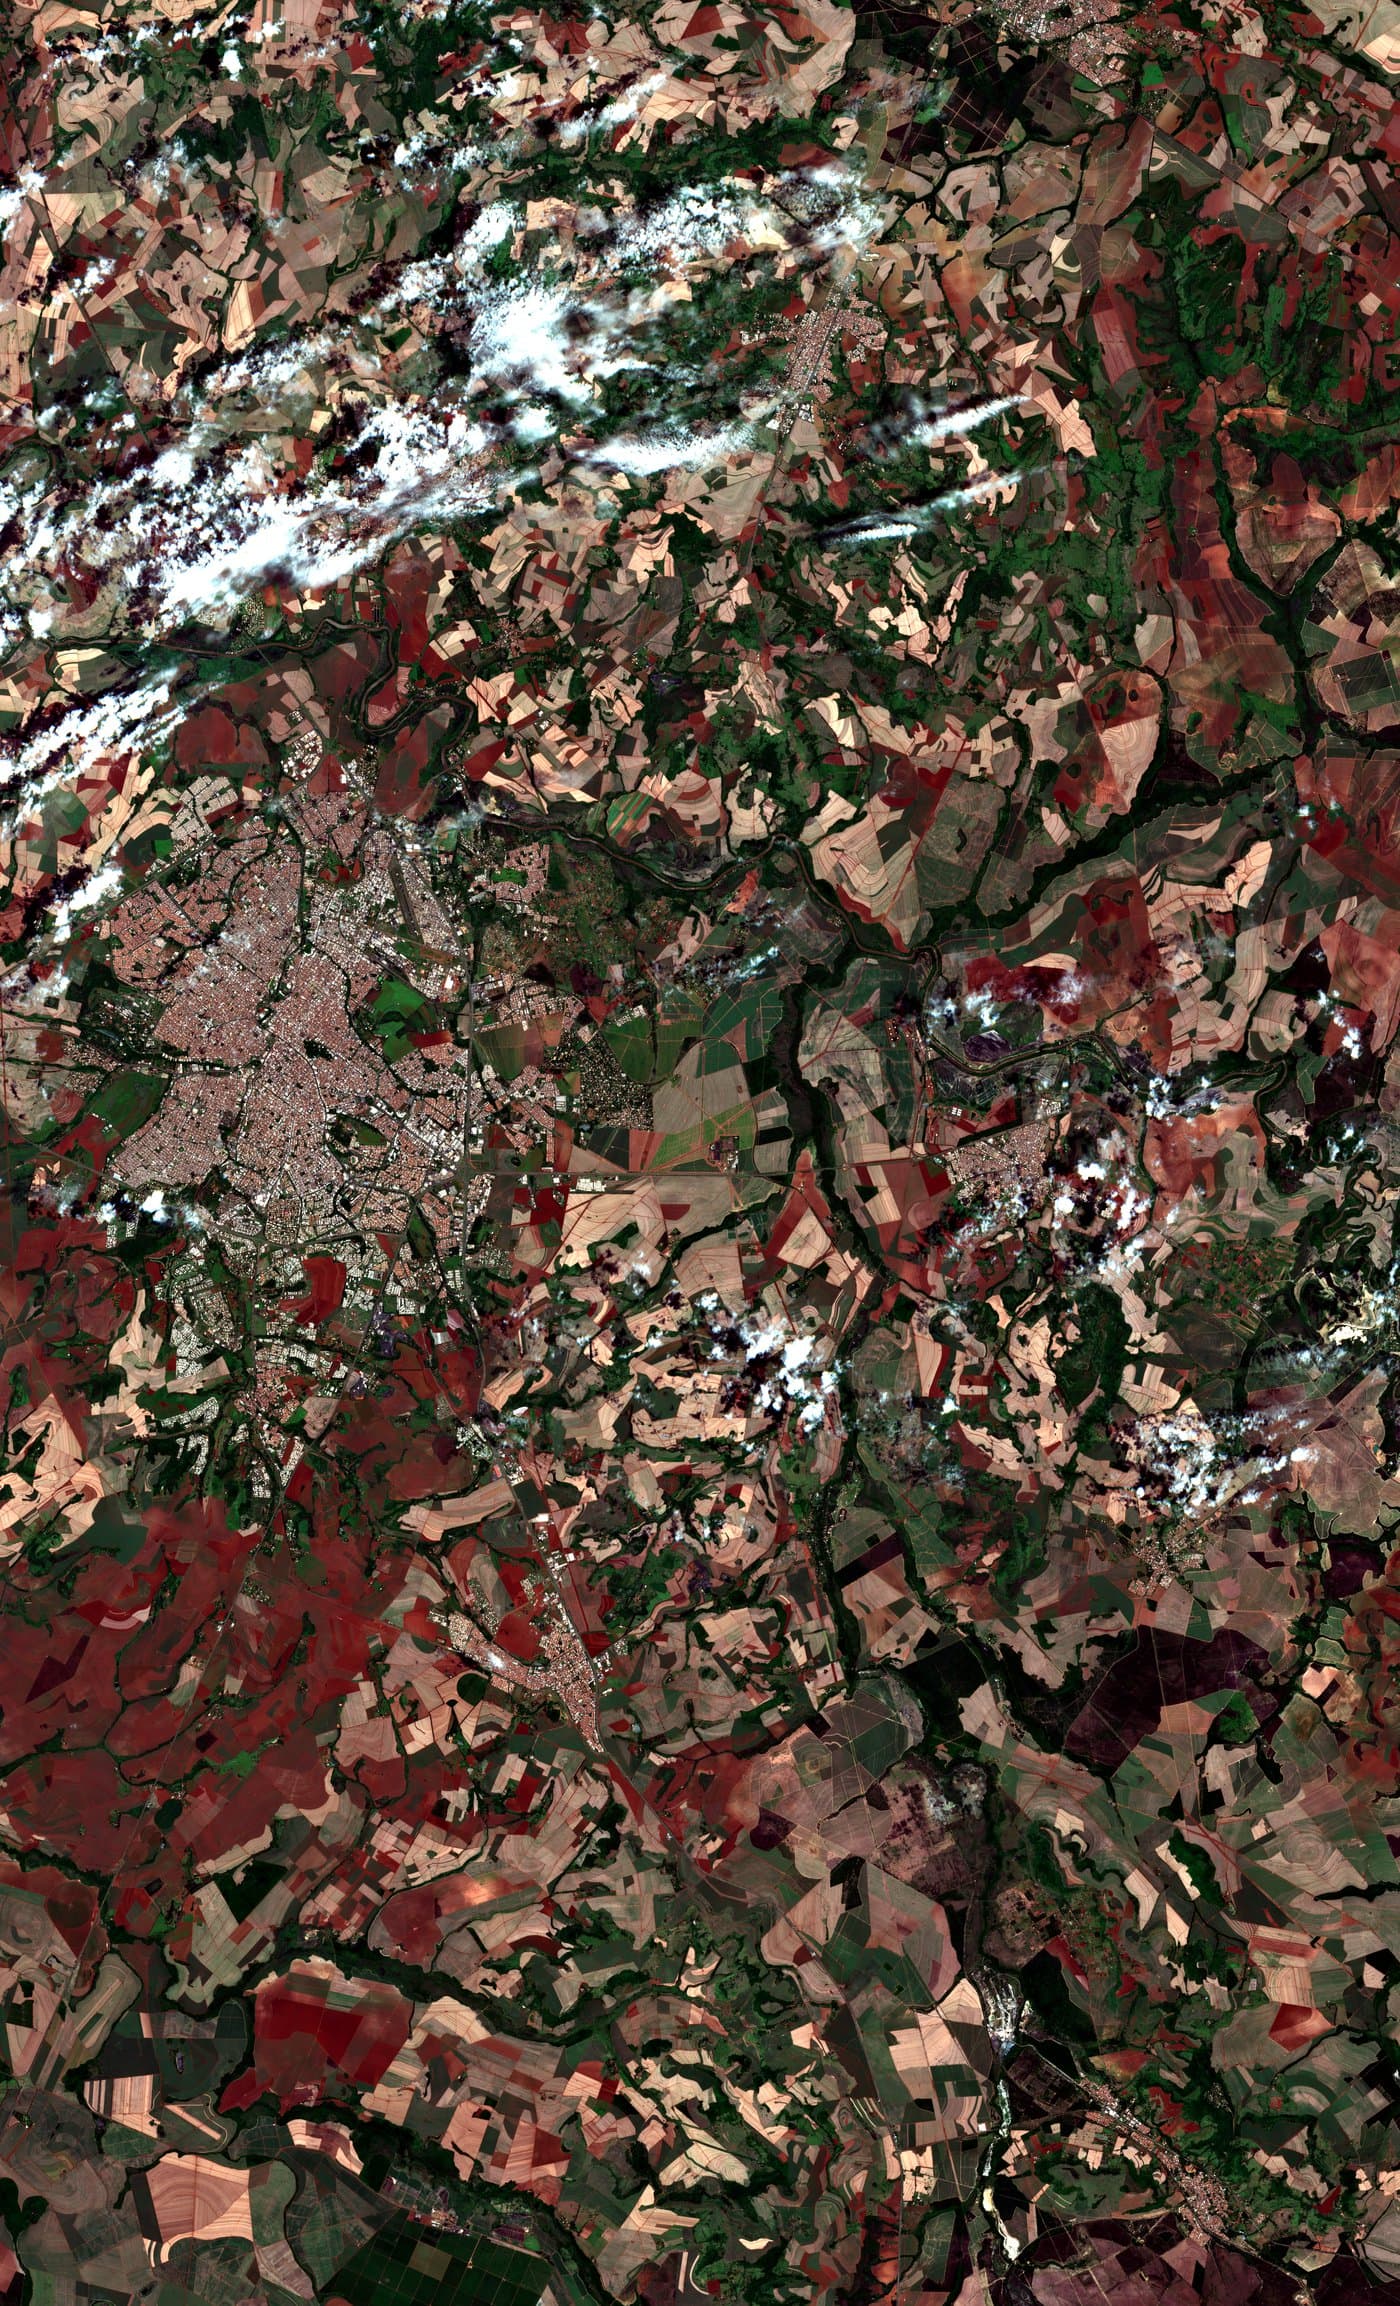
Nov 2024
Late dry season
Contains modified Copernicus Sentinel data (2025).
The Platform
Land-use, classification, chain-of-custody.
Continuously verified.
Amelia’s Planetary Intelligence Platform consolidates satellite monitoring, land-use baselines, and supply-chain data into a single auditable record. Every output is mapped to the specific evidence ISCC EU 201, 202, 203 or RSB sustainability indicators require, structured the way your certifier reads, not the way a GIS team exports.
Feedstock claims get an evidence chain. The evidence chain gets updated every month. Your auditor gets a defensible record instead of a slide deck.
How it works
From Orbit to Certification Body.
Earth observation + data acquisition
Multi-source satellite imagery, Global Forest Watch, NASA FIRMS fire data, and supply-chain datasets, pulled into one workspace and continuously updated.
Feedstock classification
Custom models identify crop types, residue signals, and material that qualifies as waste under ISCC, RSB, and EU RED definitions.
Land-use change detection
Time-series analysis against 2008 (ISCC/RSB) and 2020 (EUDR) baselines flags deforestation, conversion, and protected-area proximity per plot.
Compliance mapping
Outputs are mapped to specific ISCC EU 201 / 202 / 203 control points and RSB sustainability indicators, so evidence lines up with auditor expectations.
Evidence package
An auditor-ready data package combining imagery, temporal analysis, and structured documentation your compliance team can take into a submission.
See it on your own site
Send a feedstock site (coordinates, a polygon, or a rough boundary). Get back a full land-use history report: deforestation baseline, protected-area overlap, historical change detection.
What to expect
Share a site: coordinates, polygon, or rough boundary.
Amelia compiles your land-use history report.
Review the evidence with your compliance team.
Stakeholders
Different stakeholders. Same infrastructure.
A shared evidence layer for everyone along the Sustainable Aviation Fuel chain, from field to fuel.
The producer
SAF producers
Satellite-verified land-use history and feedstock classification, mapped to ISCC EU 201, 202, and 203 and assembled into one auditor-ready evidence package. Replaces manual site visits across fragmented supply bases with a structured spatial record.
The supplier
Fuel suppliers at ReFuelEU / UK mandate airports
A single, standardised Proof of Sustainability data package in place of fragmented documentation. Designed around the specific evidence EASA reporting and the UK SAF mandate actually require.
The auditor
Certification auditors (ISCC, RSB)
An independent spatial evidence layer covering land-use history, feedstock origin, and chain-of-custody. Structured to the control points you already audit against: ISCC EU 201, 202, 203, and RSB sustainability indicators.
The aggregator
Feedstock aggregators & farmer cooperatives
Per-parcel evidence at individual-supplier resolution, turning undocumented crop residues into certified, premium-priced feedstock. No commingling of data across contracts.
Across the SAF supply chain, the same friction shows up: manual verification, fragmented data, slow audits. Geospatial intelligence collapses that friction, from field to fuel.
Common questions
Will certification bodies accept satellite-derived evidence?
Which regulations does this support?
What land-use baseline year do you use?
How does this work for fragmented supply bases, with lots of small growers or forest owners?
What happens if a parcel fails a sustainability check?
What does a typical engagement look like?
Ready to verify
Your site, your evidence.
Pick a feedstock site. Amelia maps its land-use history and flags compliance risks so your team can prepare with confidence.