

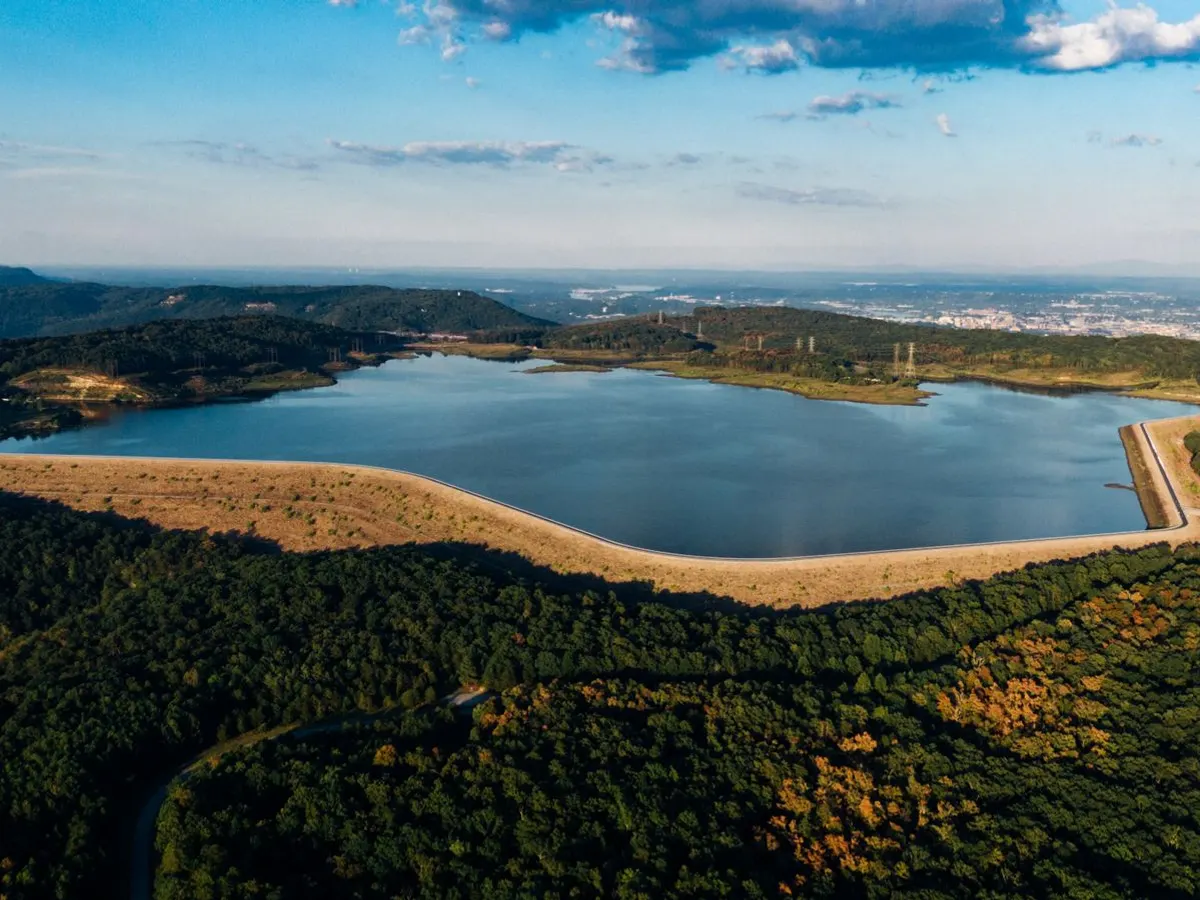
What customers notice first
An earthy, musty taste and odor in tap water, traced to geosmin and MIB from a bloom in the river or the raw water reservoir.
A cyanobacteria bloom in a supply reservoir can produce geosmin and MIB, and customers notice both at a few parts per trillion.
The event is a drop in the quality of service: more sampling, more treatment, higher operating costs, and complaints that often arrive before the cause is confirmed.
01The challenge
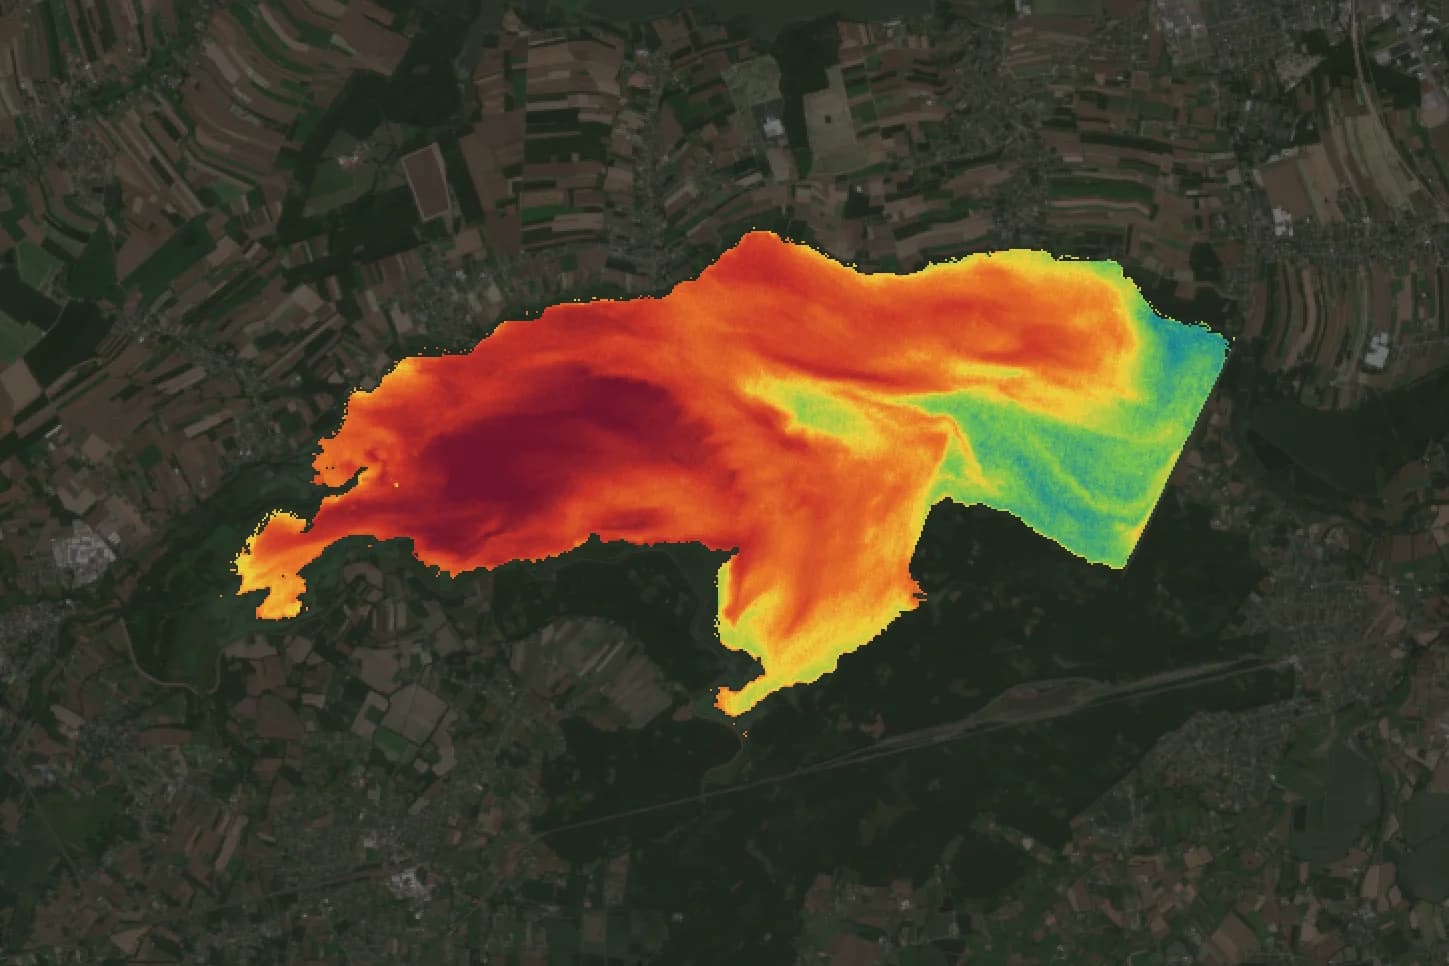
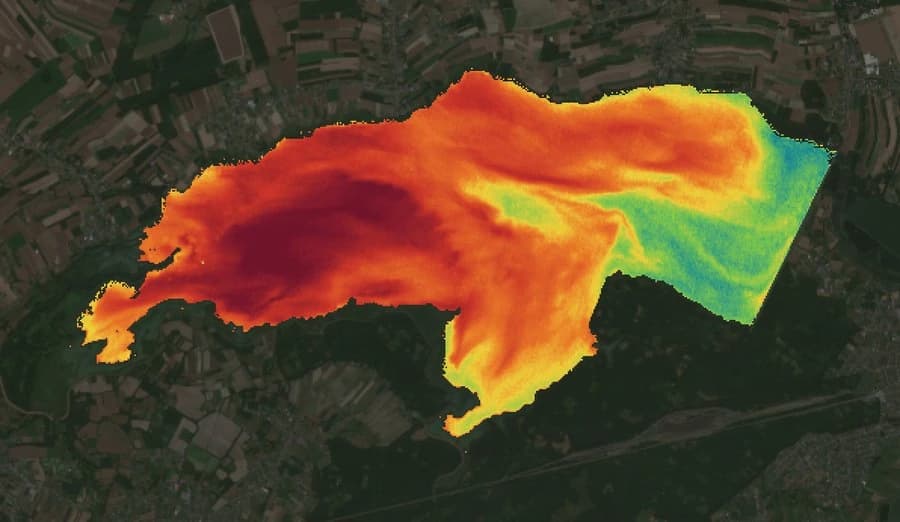
The chlorophyll signal over a supply reservoir in July, strongest in the western basin.
Cyanobacteria bloom events
- Mostly in warmer months
- Also outside the typical bloom season
- Geosmin and MIB at parts per trillion
- An earthy, musty taste at the tap
02The impact
Geosmin is noticed at about 15 parts per trillion, far below any regulated level.
Reactive treatment, higher costs
- Increased monitoring and sampling
- Powdered activated carbon dosing
- Higher operational costs
- Customer complaints and public notices
03The solution
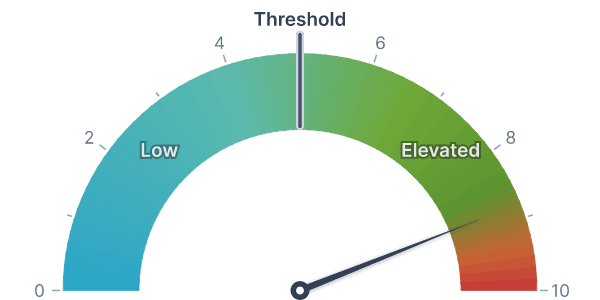
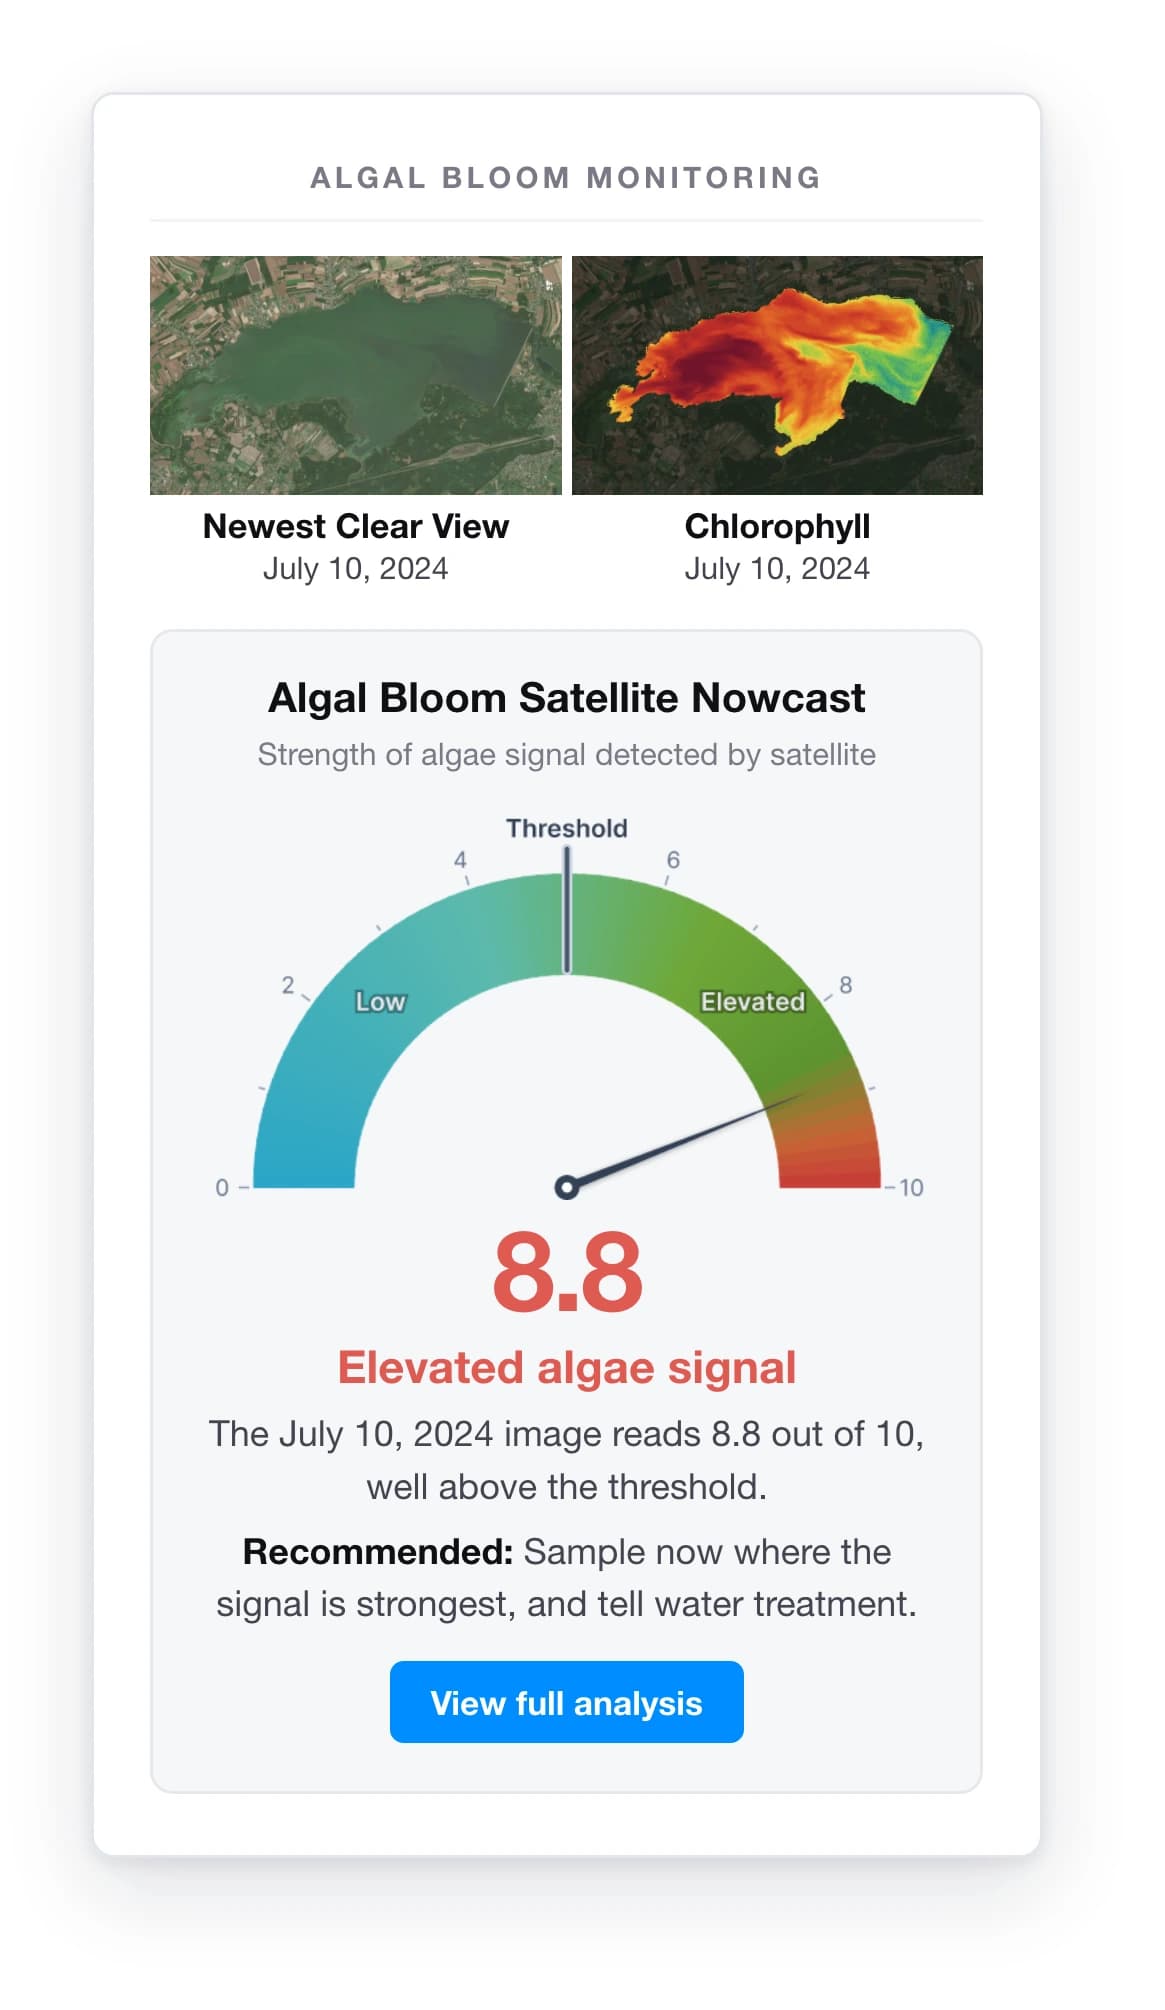
The nowcast from the alert email, on a demo reservoir. The reading is illustrative.
Forecasting, analytics, and alerts
- Earlier bloom awareness
- Better operational planning
- More efficient monitoring
- Reduced unnecessary costs

Geosmin and MIB are a taste problem before they are a data problem.
Cyanobacteria in a supply reservoir can produce geosmin and MIB. Both are detectable by taste at a few nanograms per liter, far below any level that would show up as a water quality violation. The first people to notice are the customers.
By the time a bloom is confirmed, treatment has already had to catch up: more sampling, reactive dosing changes, higher operating costs. Every one of those steps starts after the bloom is underway.
The reservoir is one part of a larger system.
Blooms are fed from upstream: fertilizer and livestock in the catchment, wastewater and industrial discharges, rainfall, and runoff, all feeding the river that fills the reservoir. Understanding a bloom means analyzing the whole of that system, from the catchment to the tap, and Amelia maps every stage of it.
Environmental system overview
From human activities in the catchment to what customers notice
Five stages, in the order water travels. Each is detailed below.
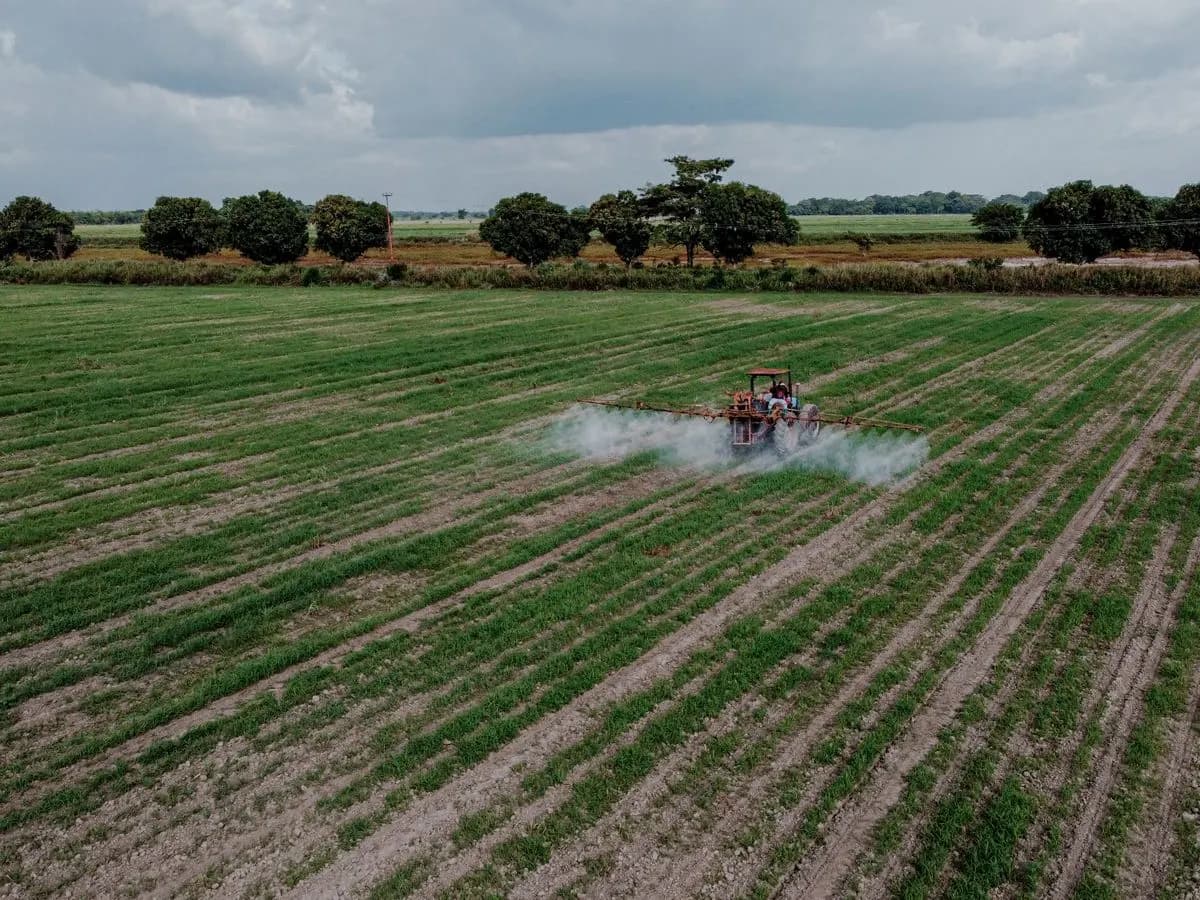
Parameters: Land use, livestock and fertilizer, discharges, rainfall, soils, and geology.
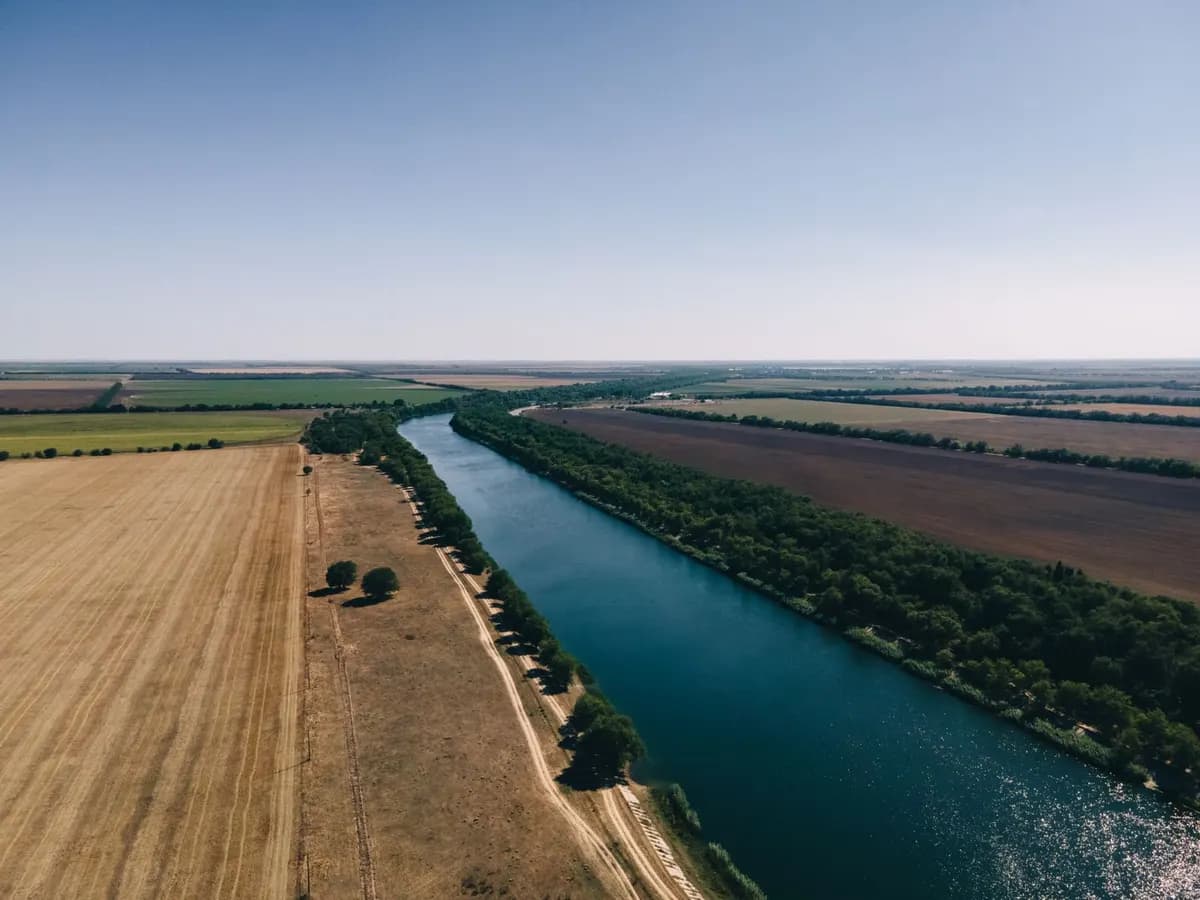
Parameters: Flow, temperature, nutrients, turbidity, and the algae already in the water.
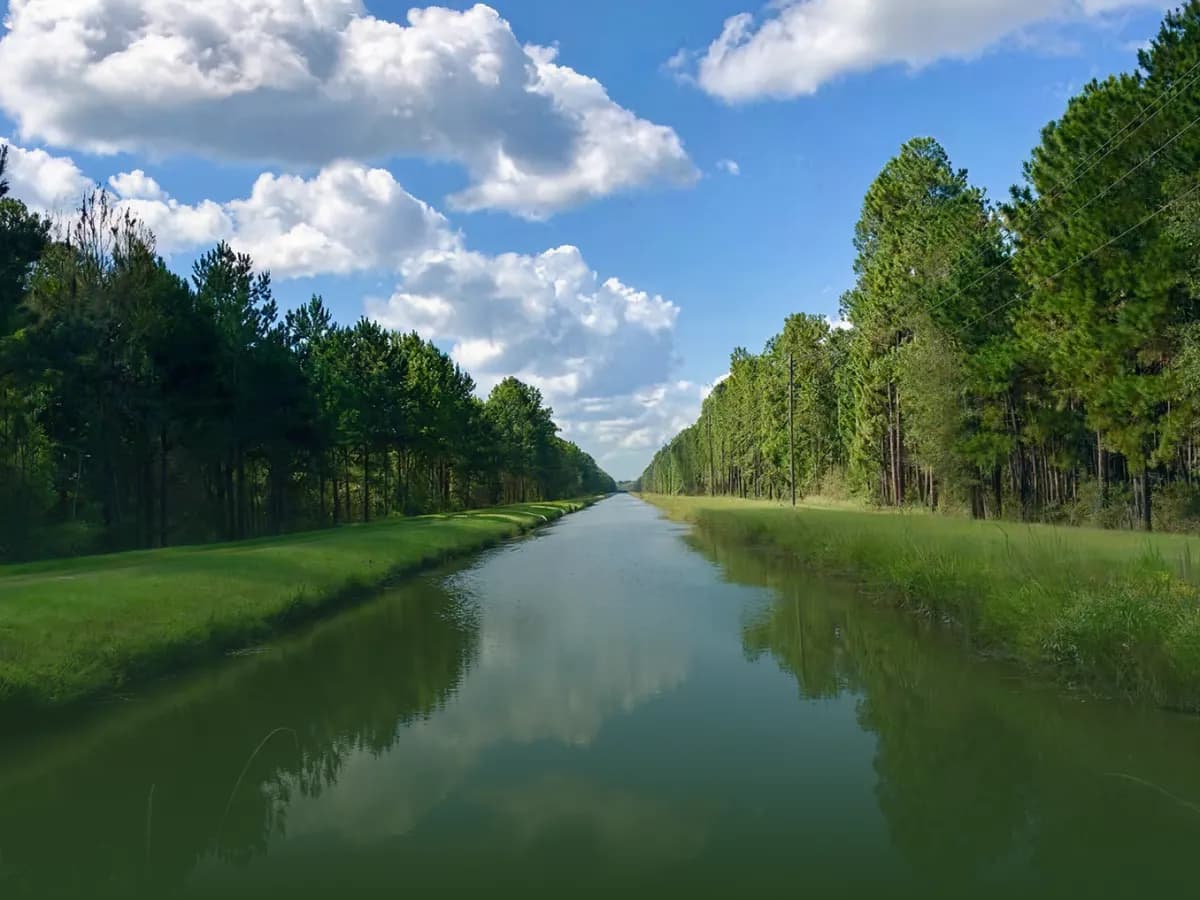
Parameters: Flow, travel time, temperature, nutrients, and turbidity.
Parameters: Physical conditions, water chemistry, and biology.
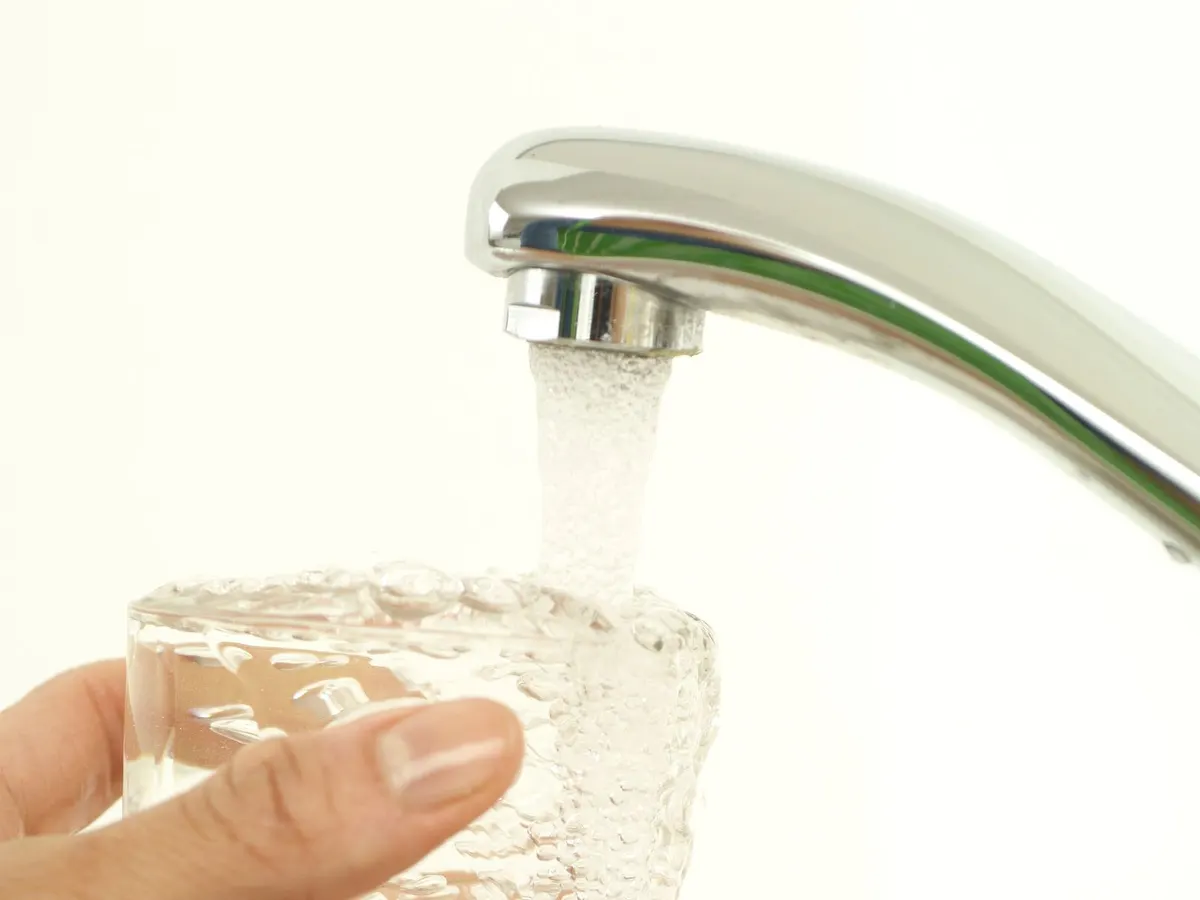
Parameters: Geosmin, MIB, and customer complaints.
Forecast algal blooms by measuring the drivers at each stage and how they interact with one another.
Stage 1 of 5
Catchment
The upstream drivers that shape the quality of water entering the river.
Key role: sets the quantity and type of nutrients, sediments, and pollutants entering the river, and ultimately the reservoir.
| Parameter | Unit |
|---|---|
| Land use / land cover | % of catchment area |
| Agriculture (area) | % of catchment area |
| Livestock density | animals/km² |
| Fertilizer application | kg N/ha/yr, kg P/ha/yr |
| Wastewater treatment plants | Number (#) or discharge (m³/day) |
| Industrial discharges | Number (#) or discharge (m³/day) |
| Parameter | Unit |
|---|---|
| Urban area / runoff | % impervious surface |
| Rainfall | mm/day |
| Soil type | Category |
| Geology | Category |
| Riparian vegetation / buffer width | m or % of area |
Stage 2 of 5
River
The quality and dynamics of the source water entering the utility’s system.
Key role: provides the baseline water quality and flow that set nutrient availability, suspended matter, and the starting conditions for algal growth downstream.
| Parameter | Unit |
|---|---|
| River discharge (flow) | m³/s (or ft³/s) |
| Water temperature | °C |
| Total phosphorus (P) | mg/L |
| Total nitrogen (N) | mg/L |
| Turbidity | Nephelometric turbidity units (NTU) |
| Parameter | Unit |
|---|---|
| Cyanobacteria / phytoplankton abundance | cells/mL (or cells/L) |
| Chlorophyll-a | µg/L |
| Phycocyanin | Relative fluorescence units (RFU) or µg/L, by sensor |
| Flow velocity (optional) | m/s |
Stage 3 of 5
Canal
Conditions and changes as water is transferred from the river to the reservoir.
Key role: conditions in the canal shape nutrient transport, temperature changes, and the timing of inputs reaching the reservoir.
| Parameter | Unit |
|---|---|
| Flow rate | m³/s (or ft³/s) |
| Travel time | Hours or days |
| Water temperature | °C |
| Total phosphorus (P) | mg/L |
| Total nitrogen (N) | mg/L |
| Turbidity | NTU |
Stage 4 of 5
Reservoir
The reservoir conditions that drive algal growth and taste and odor events.
Key role: reservoir conditions control algal growth and the production of taste and odor compounds such as geosmin and MIB, which directly affect water quality and treatment performance.
| Parameter | Unit |
|---|---|
| Physical conditions | |
| Water temperature | °C |
| Solar radiation | W/m² (or MJ/m²/day) |
| Wind speed | m/s |
| Wind direction | Degrees (°) |
| Hydraulic residence time | Days |
| Water level | m |
| Stratification (stability) | Schmidt Stability Index (J/m²) |
| Turbidity | NTU |
| Water chemistry | |
| Total phosphorus (P) | mg/L |
| Total nitrogen (N) | mg/L |
| pH | pH units |
| Dissolved oxygen | mg/L |
| Parameter | Unit |
|---|---|
| Biology | |
| Chlorophyll-a | µg/L |
| Phycocyanin | RFU or µg/L, by sensor |
| Cyanobacteria abundance | cells/mL (or cells/L) |
| Species composition | % relative abundance |
| Historical bloom occurrence | Yes/no, date, or frequency |
Stage 5 of 5
Outcomes
The operational and customer-facing outcomes the system aims to manage.
Key role: these outcomes are the operational problem a utility experiences, and the variables the forecasting model ultimately seeks to predict and manage.
| Parameter | Unit |
|---|---|
| Geosmin | ng/L |
| MIB (2-methylisoborneol) | ng/L |
| Customer complaints (taste and odor) | # per day or week |
Units may vary with the monitoring method.
References: World Health Organization (2021); Paerl and Otten (2013); U.S. Army Engineer Research and Development Center (ERDC), Harmful Algal Bloom Management Guide.
The most influential drivers of algal blooms
Of everything the system measures, these have the most influence on the forecast. The two at the top anchor it: when blooms happened, and what customers tasted.
| Driver | Why it matters |
|---|---|
| Confirmed bloom eventsMost important | Defines when blooms occurred. Essential for training and validating the model. |
| Geosmin and MIBMost important | Links blooms directly to the taste and odor events that matter operationally. |
| Phosphorus (P) | The key nutrient driving bloom growth. |
| Nitrogen (N) | Influences bloom intensity and species composition. |
| Chlorophyll-a | Tracks total phytoplankton biomass. |
| Phycocyanin | An indicator of cyanobacterial abundance. |
| Dissolved oxygen | Reflects biological activity and reservoir conditions. |
Amelia’s Planetary Intelligence Platform
What happens in the water reflects the environmental and human factors around it. Amelia’s Planetary Intelligence Platform analyzes how those factors interact, at a planetary scale, and brings the result to your team as a reading, an alert, and the week ahead.
Continuous water quality monitoring
- 01
Continuous monitoring, automated alerts
Every clear satellite image is added to the analysis and emailed to your team as soon as it is available.
- 02
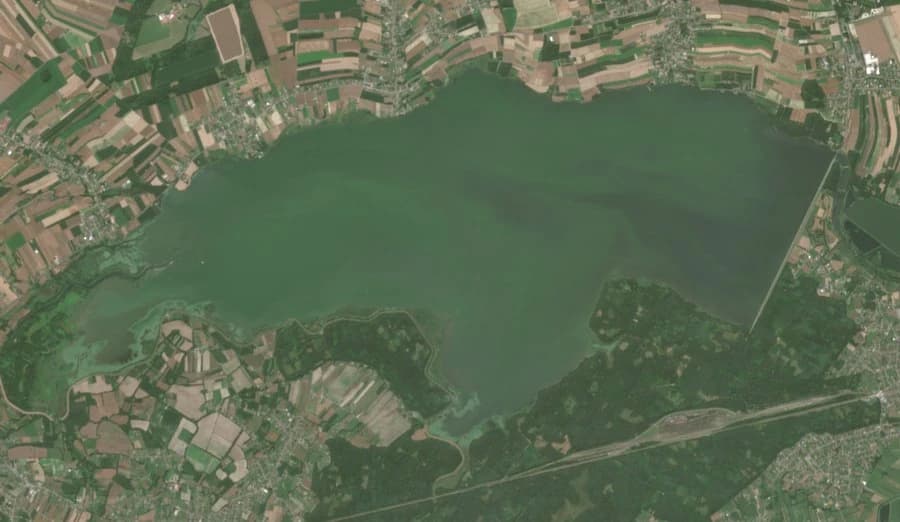
The satellite image and the analysis, side by side
The water as it appears from orbit, next to the chlorophyll data across the whole surface, so you know where to sample.
- 03
One reading against your threshold
A 0 to 10 reading, calibrated to your own samples once they are connected.
- 04
A recommended next step
What to do with the reading, such as sampling where the signal is strongest.
- 05
The platform
Historical readings, the week ahead, what is driving it, and your team’s notes and field checks.
06Historical readings
Past images and readings, to compare with today.
07Near-term bloom risk
Week-ahead risk from contributing factors.
08Team discussion
Shared notes and decisions, so teams move faster.
09Field observations
Record site visits, so you can be more accurate.
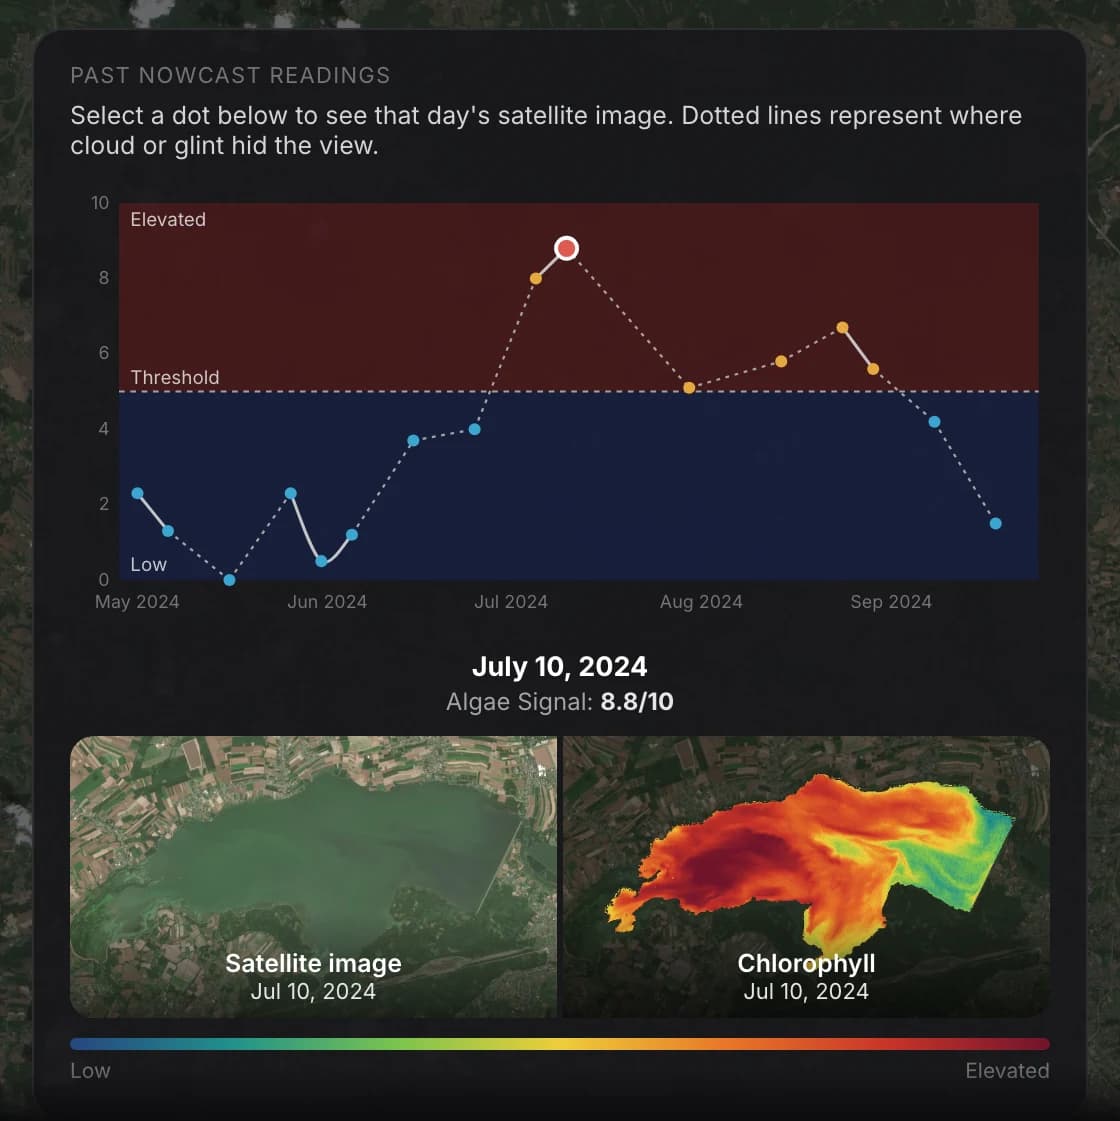
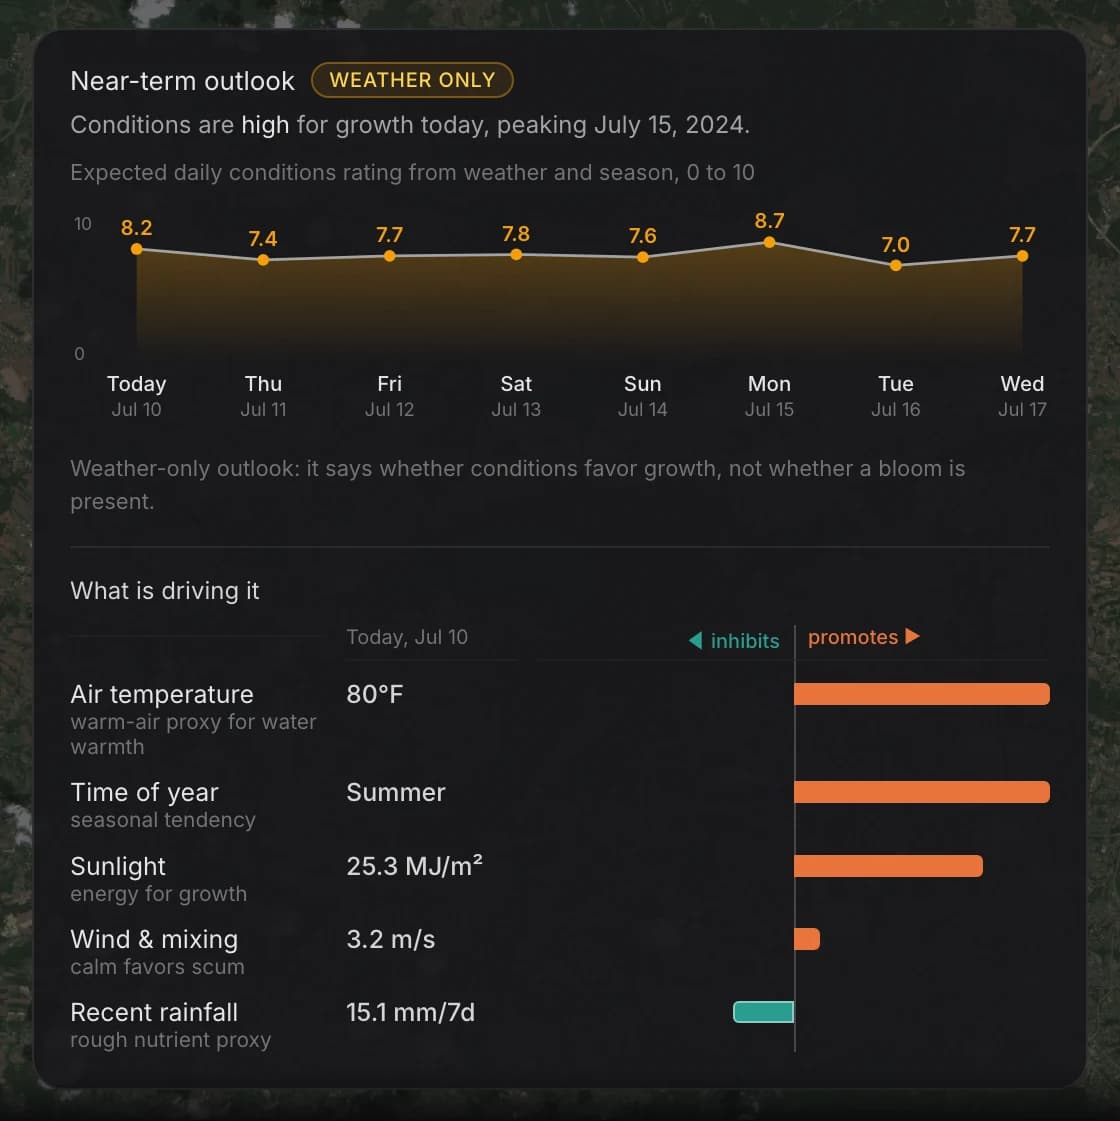
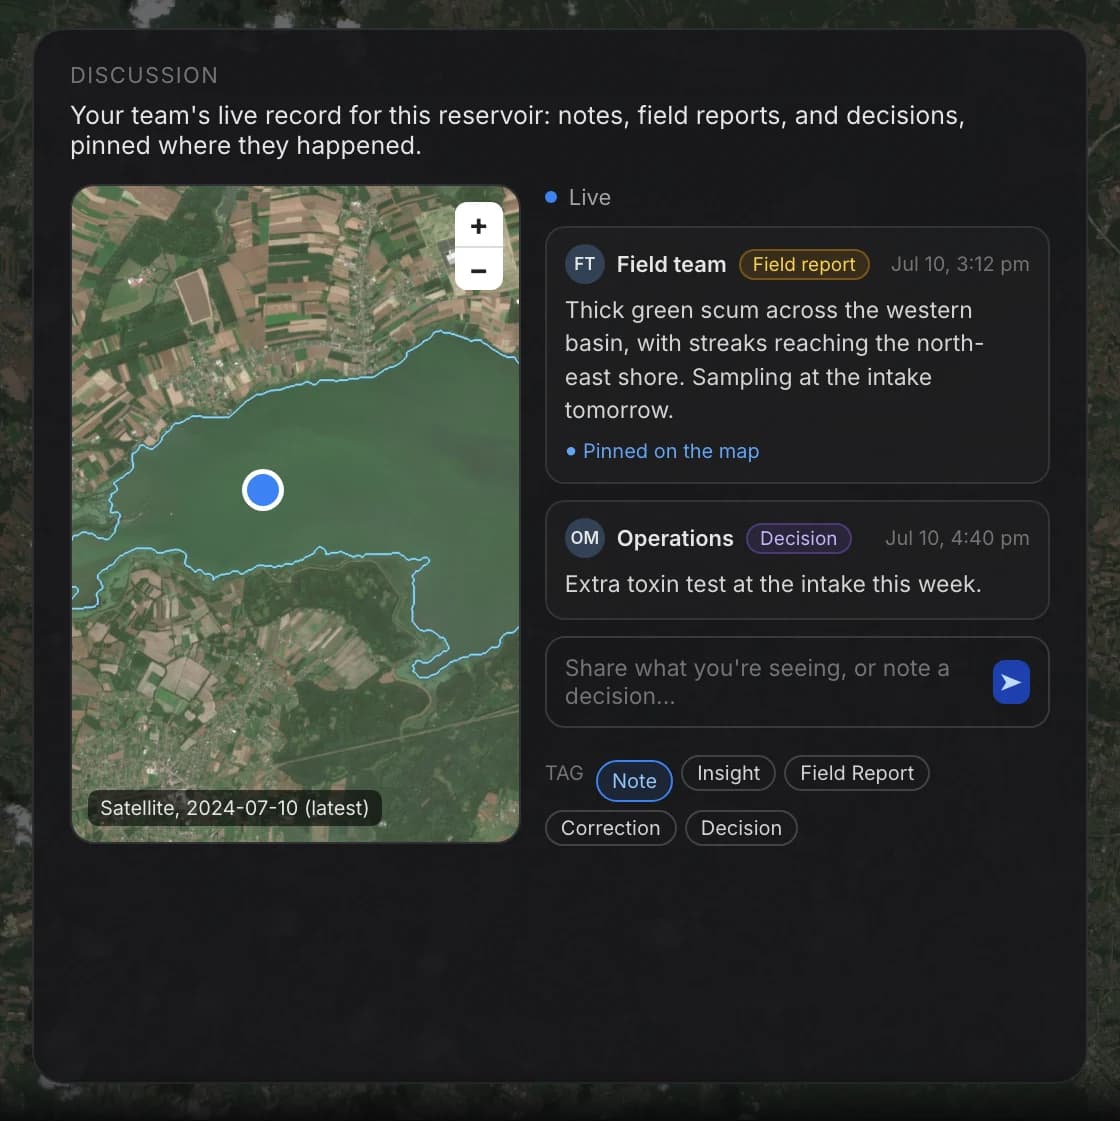
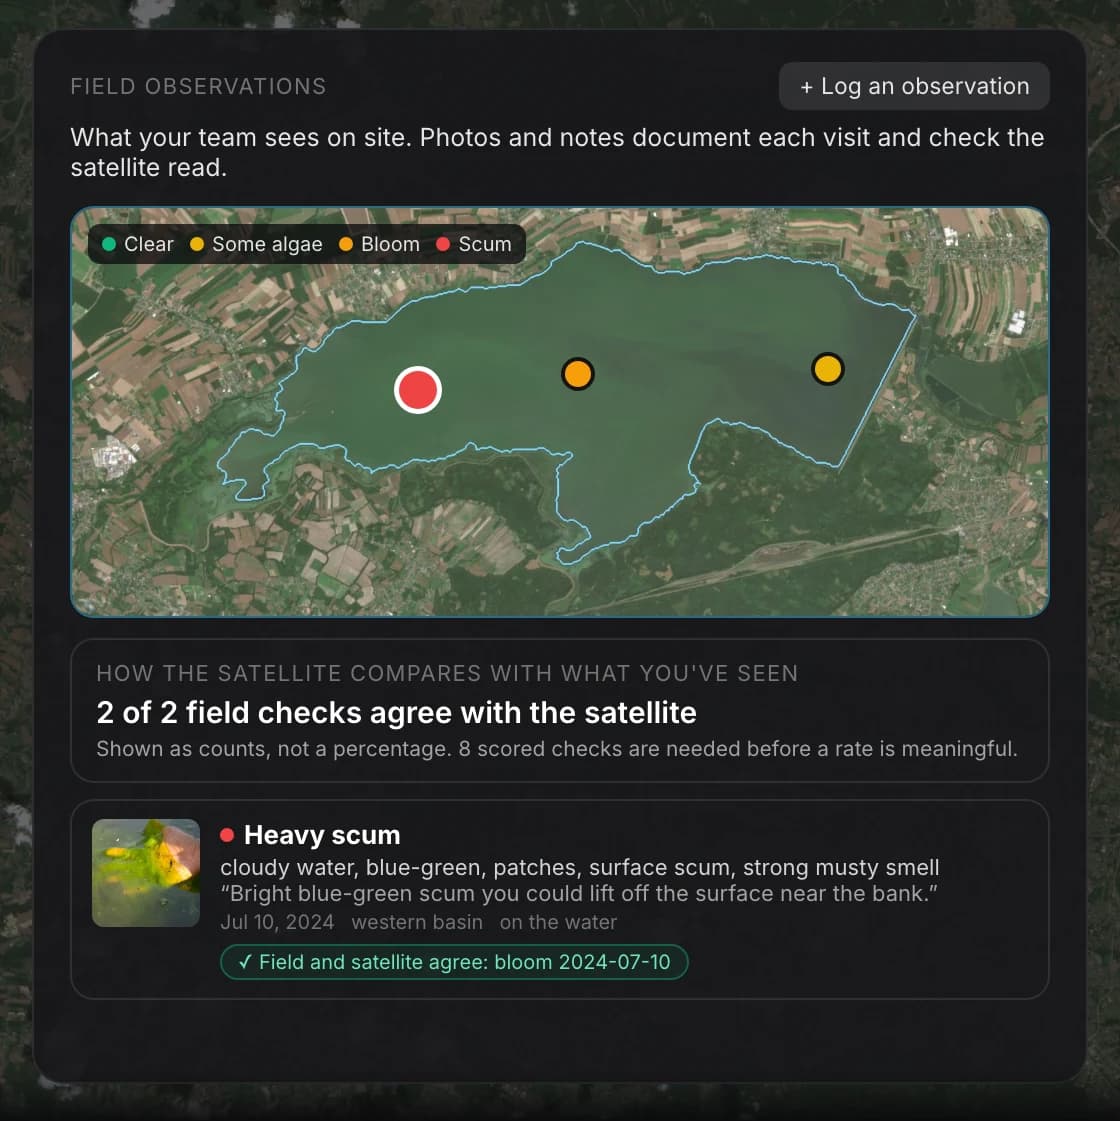
Screens shown with a demo reservoir: satellite images and weather data are real (July 2024); readings and team entries are illustrative. Contains modified Copernicus Sentinel data 2024.
One planetary picture.
Your sampling program is one layer. Amelia adds the layers around it: the catchment, the river and canal, the weather, and the satellite view of the reservoir, so each reading is seen in context, and earlier, and the whole system is in one place.
The forecast sits on top, and it sharpens as your own records are connected.
Bloom forecast
Satellite reading
Weather
Your samples
River and canal
Catchment
Basemap
Continue exploring

What challenge would you bring to Amelia?
Water quality, emissions monitoring, feedstock verification, or something new: if it involves understanding what is happening on the ground, Amelia would like to hear about it.
Prefer email? info@ameliaspace.com