

Case study: Goczałkowice reservoir, Poland
Water quality alerts from space
The Goczałkowice reservoir in southern Poland feeds a treatment plant that produces about 45% of the drinking water supplied by GPW (Górnośląskie Przedsiębiorstwo Wodociągów), the regional supplier for Upper Silesia. This is roughly the water used by 1.6 million people. In summer 2024, satellite images showed the chlorophyll signal well above its usual level for the time of year. On 1 August 2024, GPW reported a cyanobacteria bloom there.
Some cyanobacteria produce toxins, and some give water an earthy or musty taste and odor. Since January 2026, EU rules have required drinking-water suppliers to test for the toxin microcystin-LR when a bloom is possible in their source water.
Amelia Space Technologies analyzes how environmental and human factors interact at planetary scale. For a water body, that means the land, rivers, weather and people around it, together with measurements on the ground.
This case study focuses on the part satellite images play. Amelia processed 312 satellite passes over Goczałkowice across ten summers, from 2017 to 2026, and compared clear images with the same weeks in earlier years. It flagged any image with an unusually high chlorophyll signal for the time of year, and two flagged images in a row raised an alert.
If Amelia had been monitoring Goczałkowice in 2024
- 15 JuneFirst flagThe chlorophyll signal is unusually high for the time of year.
- 10 JulyAlertA second flag in a row, after 5 July.
- 30 JulyWhereThe strongest signal is packed into the northeast corner, near Łąka and the water intake.
- 1 AugustReportedGPW reports a cyanobacteria bloom in the northeastern part of the reservoir.
Amelia’s monitoring would have flagged unusual water on 15 June and raised an alert on 10 July, before the bloom was reported publicly on 1 August. GPW’s own monitoring may well have picked it up sooner, and this replay says nothing about who would have acted, or when. What satellites add is a view of the whole water surface on clear days, between samples.
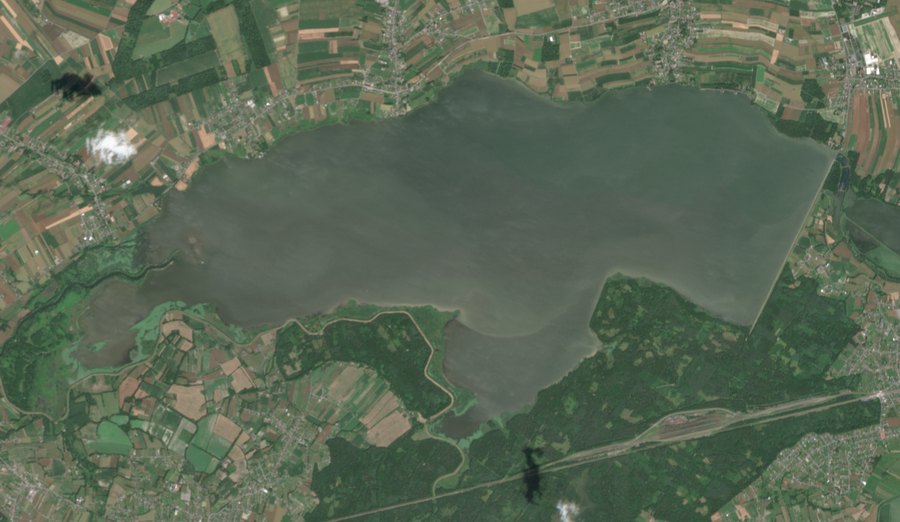
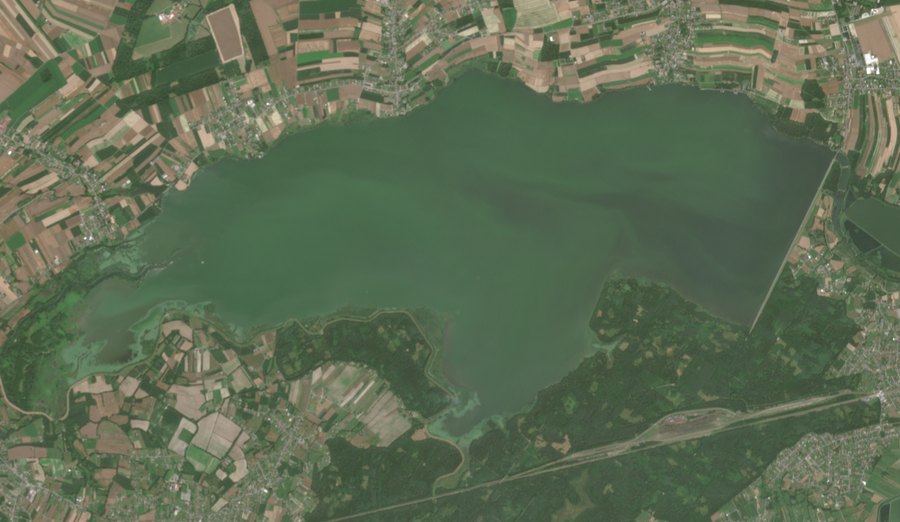 Chlorophyll signal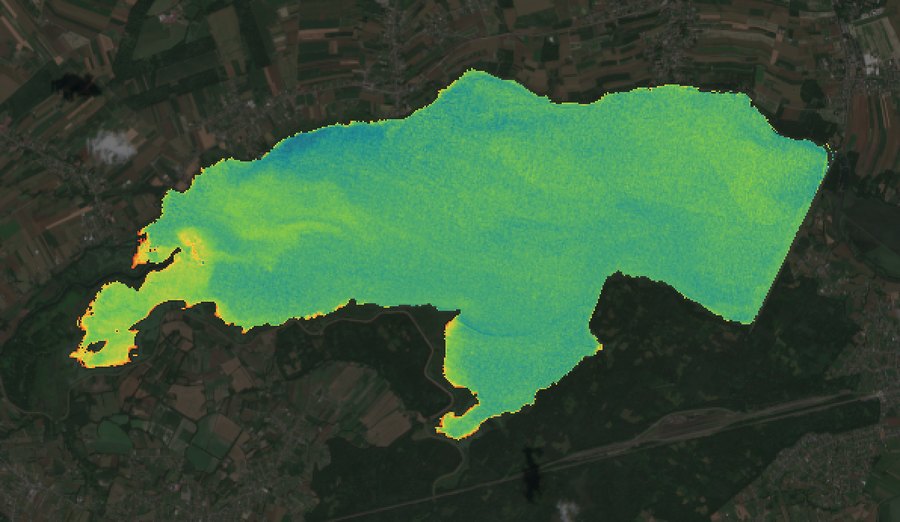
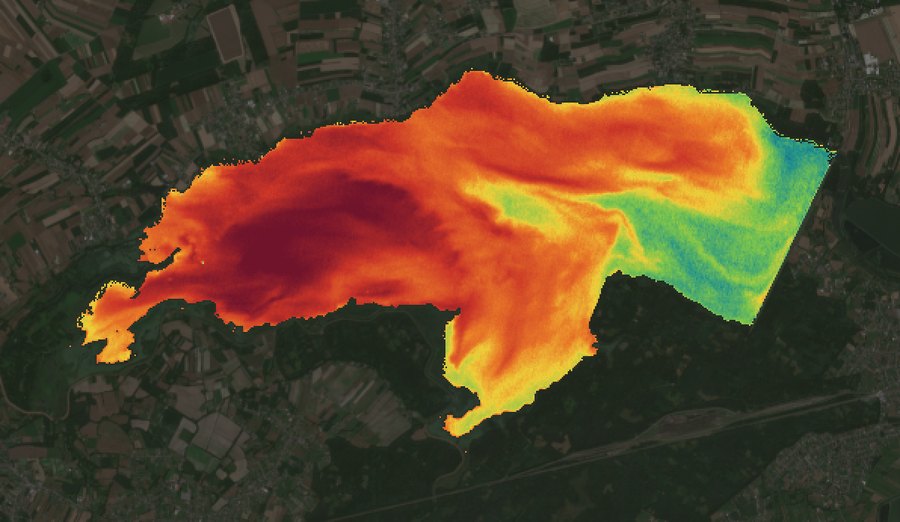
The same week, a year apart. Chlorophyll is the green pigment in algae and in cyanobacteria. The bottom row shows the relative strength of its signal across the water, from lower (blue) to higher (dark red), not a concentration. Both years use the same color scale.
Summer 2024, image by image
These are the clear satellite images of the reservoir from May to September 2024, in date order. The line above them places each image on the day it was taken. Its gaps are cloudy spells, when satellites could not see the water. Orange marks the images that were flagged. Light gray shows water hidden by cloud or cloud shadow that day. The white dot sits at Łąka, on the northeast shore, where the reservoir’s main water intake is.
1 May 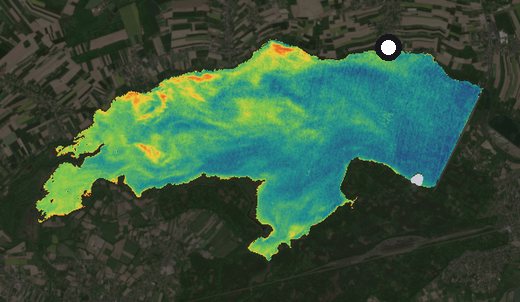
6 May 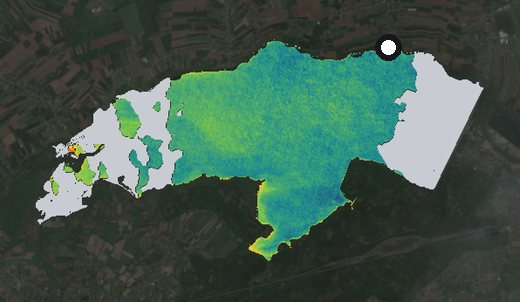
16 May 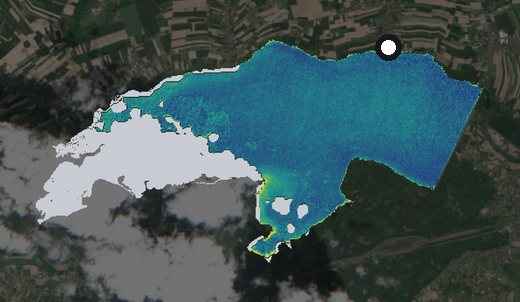
26 May 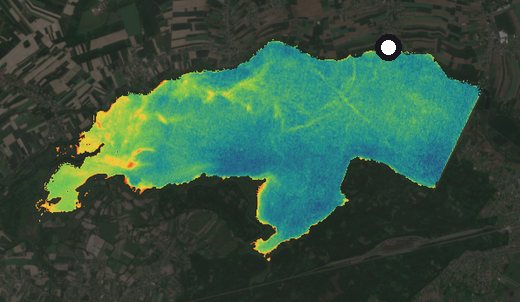
31 May 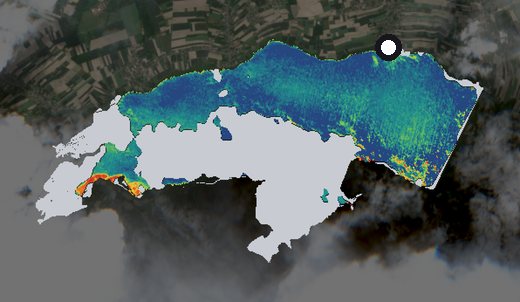
5 June 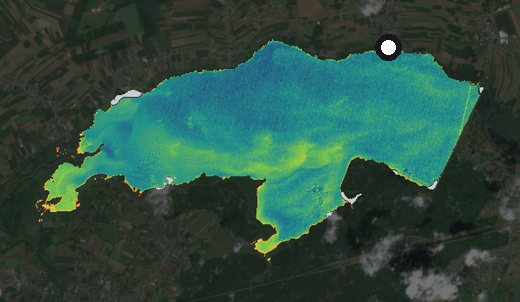
15 Juneflagged 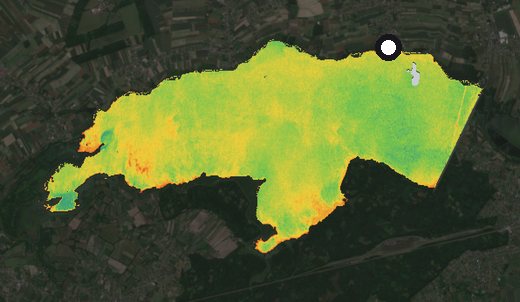
25 June 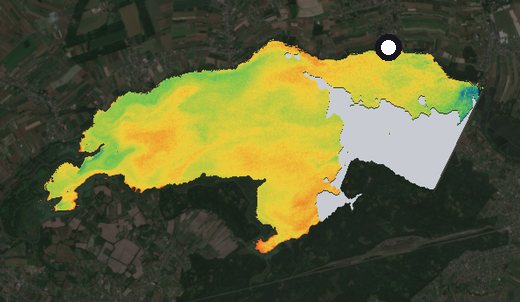
5 Julyflagged 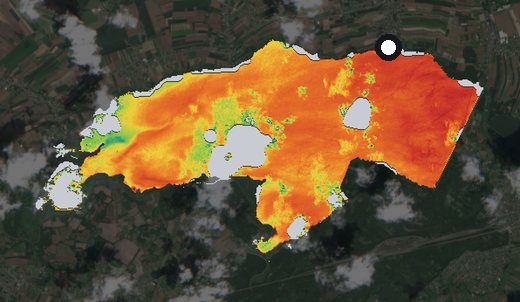
10 Julyalert 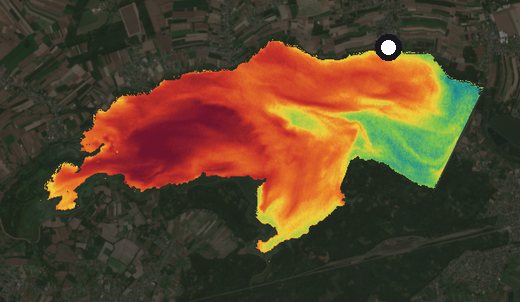
30 July 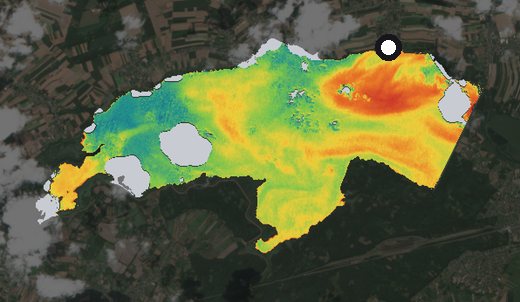
14 August 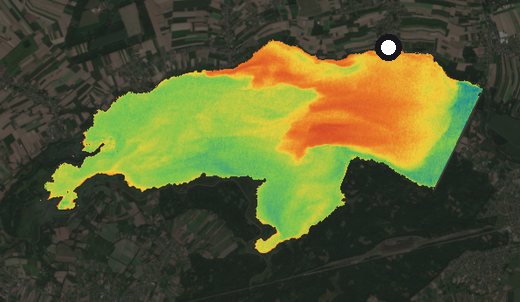
24 August 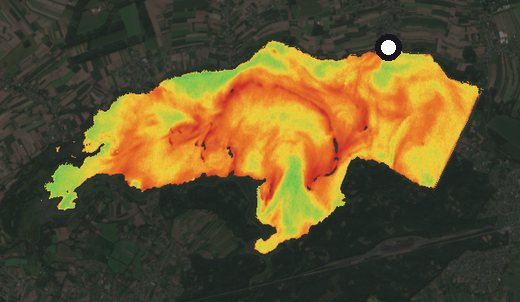
29 August 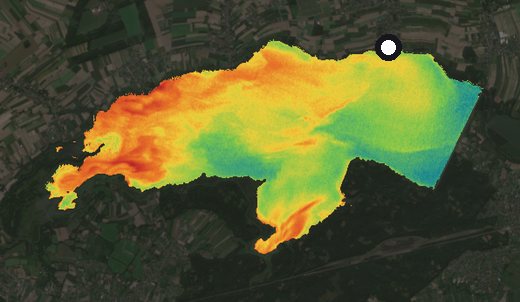
8 September 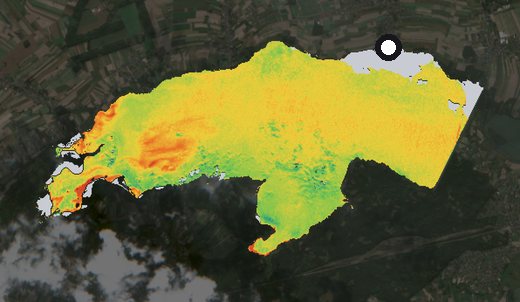
18 September 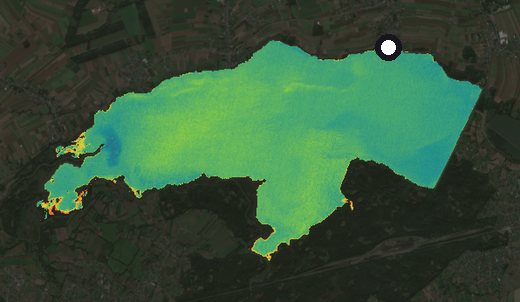
What the images show
The chlorophyll signal was normal for the time of year until early June 2024. On 15 June it rose above its usual level across almost all of the water, and on 5 and 10 July it read higher still. On 10 July the strongest signal was across the western half of the reservoir. By 30 July it was strongest off the northeast shore, the area where GPW reported the bloom on 1 August. Surface patches drift with the wind, so each image shows where the signal was strongest on that day. By 18 September the signal was back to normal.
Does the satellite picture match what happened?
- At Goczałkowice. On 30 July 2024, the last clear image before GPW’s report, most of the water with the strongest signal lay within 2 km of Łąka, in the part of the reservoir GPW named.
- At a second reservoir, in 2026. The same monitoring, run on Zegrze, which supplies Warsaw’s northern water plant, flagged the image of 15 July 2026, the day a sanitary inspector’s decision to close two of its bathing sites over a cyanobacteria bloom was published. An alert followed on 17 July.
How it works
How the monitoring decides what is unusual
- usual range (from 2018 to 2023)
- flag line
- image
- flagged image
- alert
- GPW's report
How to read the chart. Each dot is one clear image, and its height is the level the greenest tenth of the water reaches. The shaded band is the usual range for each date. It comes from the summers before 2024, using images from the same weeks of 2018 to 2023. The dashed orange line along the top of the band is the flag line: an image above it is flagged as unusual, and two flagged images in a row raise an alert. The chart leaves out the very highest readings, so on the greenest days the dots sit lower than the images show.
Why the usual range rises. Every reservoir has its own normal. Goczałkowice is shallow, about 5 m deep on average, and rich in nutrients. In earlier summers its chlorophyll signal rose from May to late summer as warmth, light and nutrients let algae grow. So the usual range climbs through the summer, and the flag line follows it. That is why 25 June 2024 was not flagged, although its signal was a little stronger than on 15 June. In late August the signal was high again, but it had been at least as high at that time of year in 2020 and 2022, so those images raised no flag.
This replays the monitoring as it would have run at the time, with each image compared with the summers before it. The replay shows what the monitoring would have flagged, and says nothing about who would have acted, or when. Applied the same way to every summer from 2020 to 2026 (2026 to date), it raised alerts at Goczałkowice in two summers, 2022 and 2024. The 2024 alert matches a public report of a bloom; no report was found for 2022.
Summer 2026: a quiet year so far
25 June 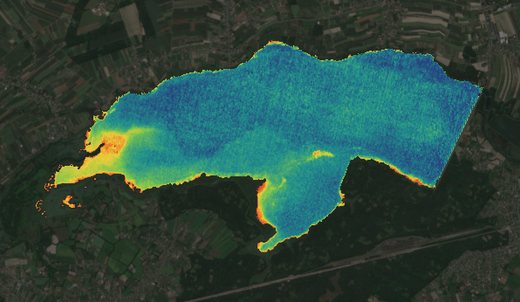
30 July 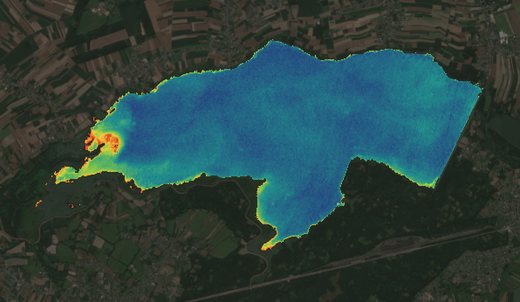
14 August 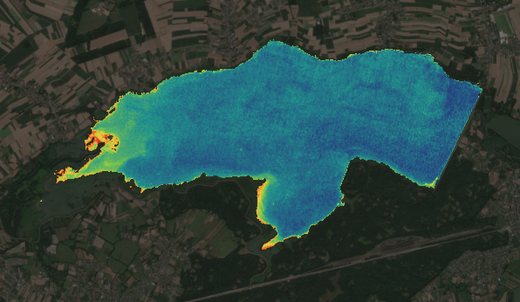
8 September 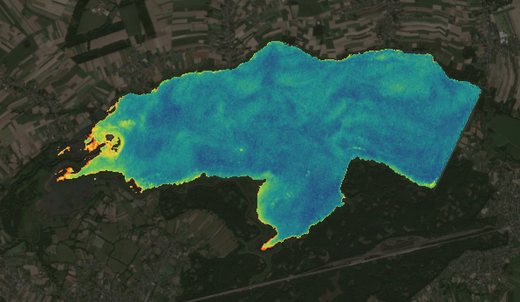
The clearest image of each month of summer 2026, on the same color scale. So far, none of the 2026 images has been unusual for the time of year. The small area at the western end, where the river flows in, reads higher than the rest of the water in all four images, as it did in quiet images from 2023 and 2024. Near an inflow or over a shallow bed, sediment carried in and plants on the bottom can raise the signal. 2024 is the example in this case study because it is the latest summer with a public report of a bloom at Goczałkowice.
Part of a wider system. What happens in the water reflects environmental and human factors around it: rivers carrying nutrients from farmland, towns and villages, warm and calm weather, and how the land and water are used. Satellite images are one part of that picture: with catchment information and your measurements, they can help investigate nutrient sources and show where the signal is strongest.
Reservoirs, lakes, rivers and coasts
From planetary monitoring to better decisions
Satellite monitoring is one component of how Amelia analyzes the wider environmental system, together with your own sampling, the catchment and the weather.
Example alert, recreated from the 2024 images
Goczałkowice reservoir, 10 July 2024
The chlorophyll signal has been unusually high for the time of year in two images in a row, on 5 July and 10 July. The strongest signal is across the western half of the reservoir.
Each alert comes with the latest image, so your team can see where to check. An alert is a prompt to look, not a test result.
Spot changes anywhere on the water
Samples cover a few points; images show the whole surface on clear days. The latest one reveals where the signal peaked, to help your team decide where to check.
Understand what drives blooms
Amelia’s team can review land use, rivers, nutrient sources and weather with you, to investigate likely causes and the measures other operators use against blooms.
Ground and space data together
Your laboratory results, sensor data and field reports sit beside the satellite record, and your results tune the alerts to your own reservoir.
Decide when to act
An alert can prompt an extra sample or toxin test between rounds, and a taste-and-odor forecast from your own laboratory history helps plan treatment. A flag is one documented input to each decision.
Evidence for your risk assessment
Dated images and catchment maps can support the catchment risk assessment every Polish supplier must file by 31 December 2026, covering land use, inflows and hazards to water quality and health.
Spend where it counts
Targeting samples, treatment and call-outs can help avoid unnecessary costs. Amelia can weigh the potential savings against the cost of the service, using your figures.
Where the same approach could help
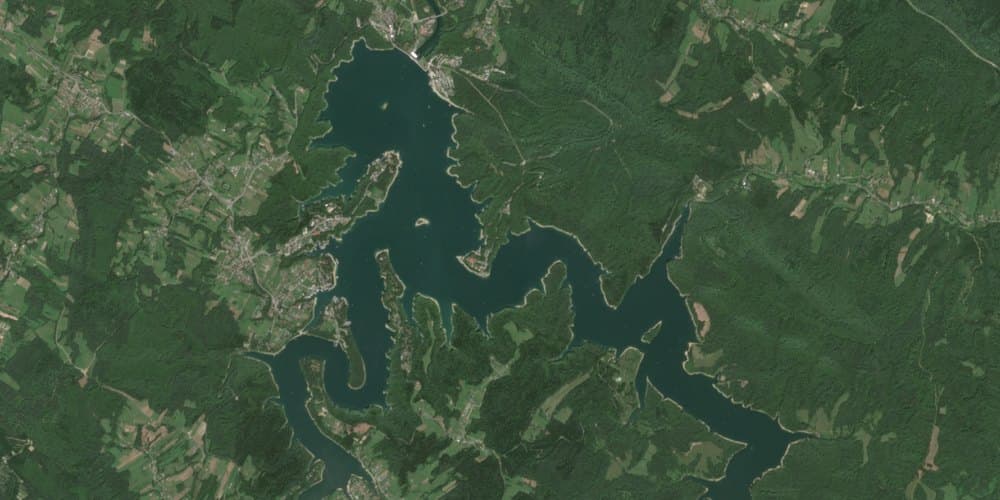
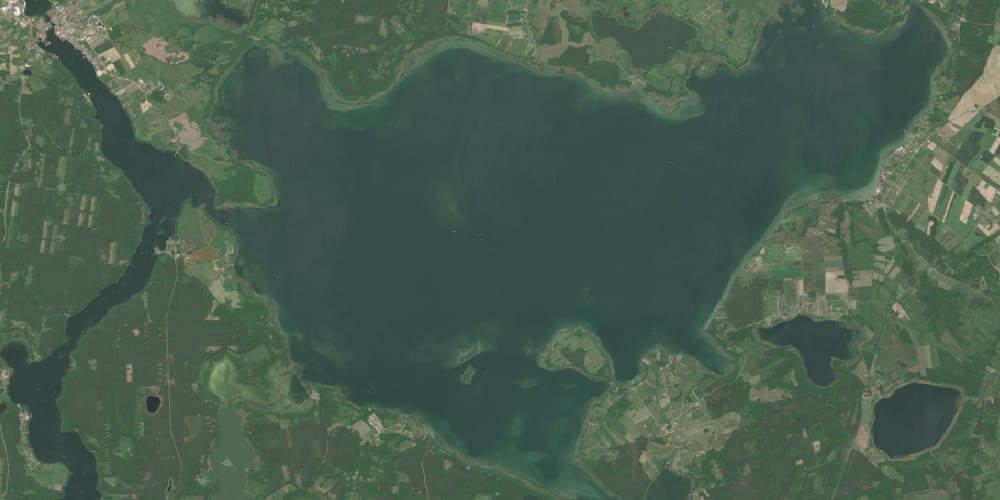
- Drinking-water supply, between laboratory samples.
- Tourism, fishing and restoration projects.
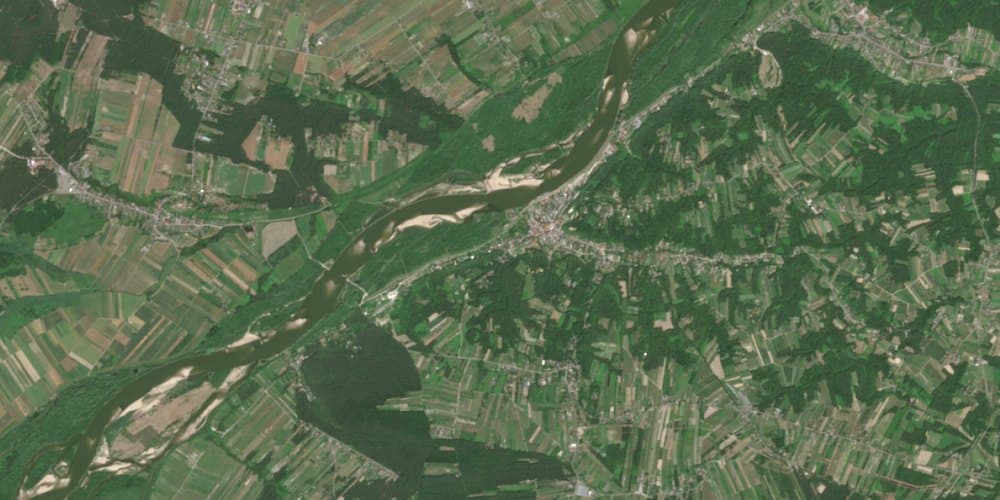
- Wide stretches, about 200 m across or more.
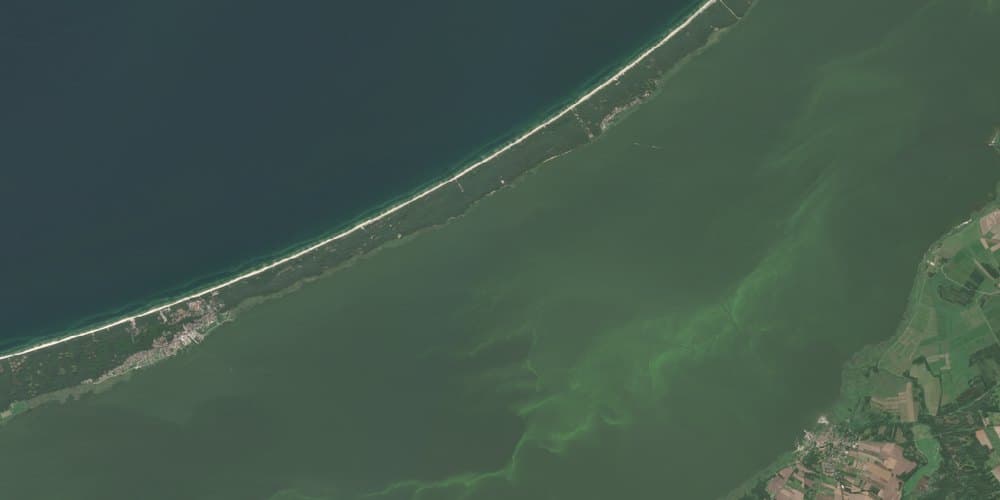
- Bathing waters, bays and lagoons.
Next step
Start with one water body
- Name a water body that matters to you.
- Agree on the scope and cost of the record and catchment map.
- Walk through the record together, with your own data alongside.
Questions and answers
What happened at the Goczałkowice reservoir in 2024?
In summer 2024, satellite images showed the chlorophyll signal at the Goczałkowice reservoir in southern Poland well above its usual level for the time of year. The signal is relative, not a concentration. On 1 August 2024, GPW, the regional water supplier for Upper Silesia, reported a cyanobacteria bloom in the northeastern part of the reservoir. The reservoir feeds a treatment plant that produces about 45% of GPW’s drinking water.
What can satellite images show about algae and cyanobacteria?
Satellite images show the chlorophyll signal across the whole water surface on clear days, between samples. Chlorophyll is the green pigment in algae and in cyanobacteria. The images show the relative strength of its signal across the water, not a concentration, so an alert is a prompt to look, not a test result.
How does the monitoring decide what is unusual?
Every reservoir has its own normal, so the monitoring compares each clear image with the same weeks in earlier summers. An image with a chlorophyll signal above the usual range for the date is flagged as unusual, and two flagged images in a row raise an alert. The signal is relative, not a concentration. An alert is a prompt to look, not a test result.
What would satellite monitoring have shown at Goczałkowice in 2024?
Replayed as it would have run at the time, Amelia’s monitoring would have flagged unusual water on 15 June 2024 and raised an alert on 10 July, before the bloom was reported publicly on 1 August. GPW’s own monitoring may well have picked it up sooner. The replay says nothing about who would have acted, or when. An alert is a prompt to look, not a test result.
Do EU drinking-water rules require testing for cyanobacteria toxins?
Since January 2026, EU rules have required drinking-water suppliers to test for the toxin microcystin-LR when a bloom is possible in their source water. In Poland, every supplier must also file a catchment risk assessment by 31 December 2026, covering land use, inflows and hazards to water quality and health. Dated images and catchment maps can support that assessment.
Does satellite monitoring replace laboratory sampling?
No. Samples cover a few points; images show the whole surface on clear days. Satellite monitoring is one component, together with a supplier’s own sampling, the catchment and the weather. An alert can prompt an extra sample or toxin test between rounds, and laboratory results tune the alerts to each reservoir.
Where else could satellite alerts help?
The same approach could help at reservoirs for drinking-water supply, between laboratory samples; at lakes used for tourism, fishing and restoration projects; on rivers, at wide stretches about 200 m across or more; and on coasts, at bathing waters, bays and lagoons. It needs clear days, because cloud and cloud shadow hide the water.
Sources and credits
Contains modified Copernicus Sentinel data 2017 to 2026. Earth image: NASA Earth Observatory. Reservoir outlines and place locations © OpenStreetMap contributors (ODbL).
Plant and reservoir facts: PZITS, report of a technical visit to ZUW Goczałkowice, 5 June 2023; IBR wiki, Zbiornik Goczałkowice. The Łąka intake: IBR wiki; fotopolska.eu.
Reports: GPW’s statements of 1 August 2024 and 19 August 2024 as reported by pless.pl; the Zegrze decision as reported by legio24.pl, 15 July 2026.
Images of other water bodies: Solina, Lake Śniardwy, the Vistula at Kazimierz Dolny and the Vistula Lagoon, 2025.
Law: Dz.U. 2026 poz. 605; Directive (EU) 2020/2184, Article 25 and Annex I Part B.
A technical note on the method is available on request.