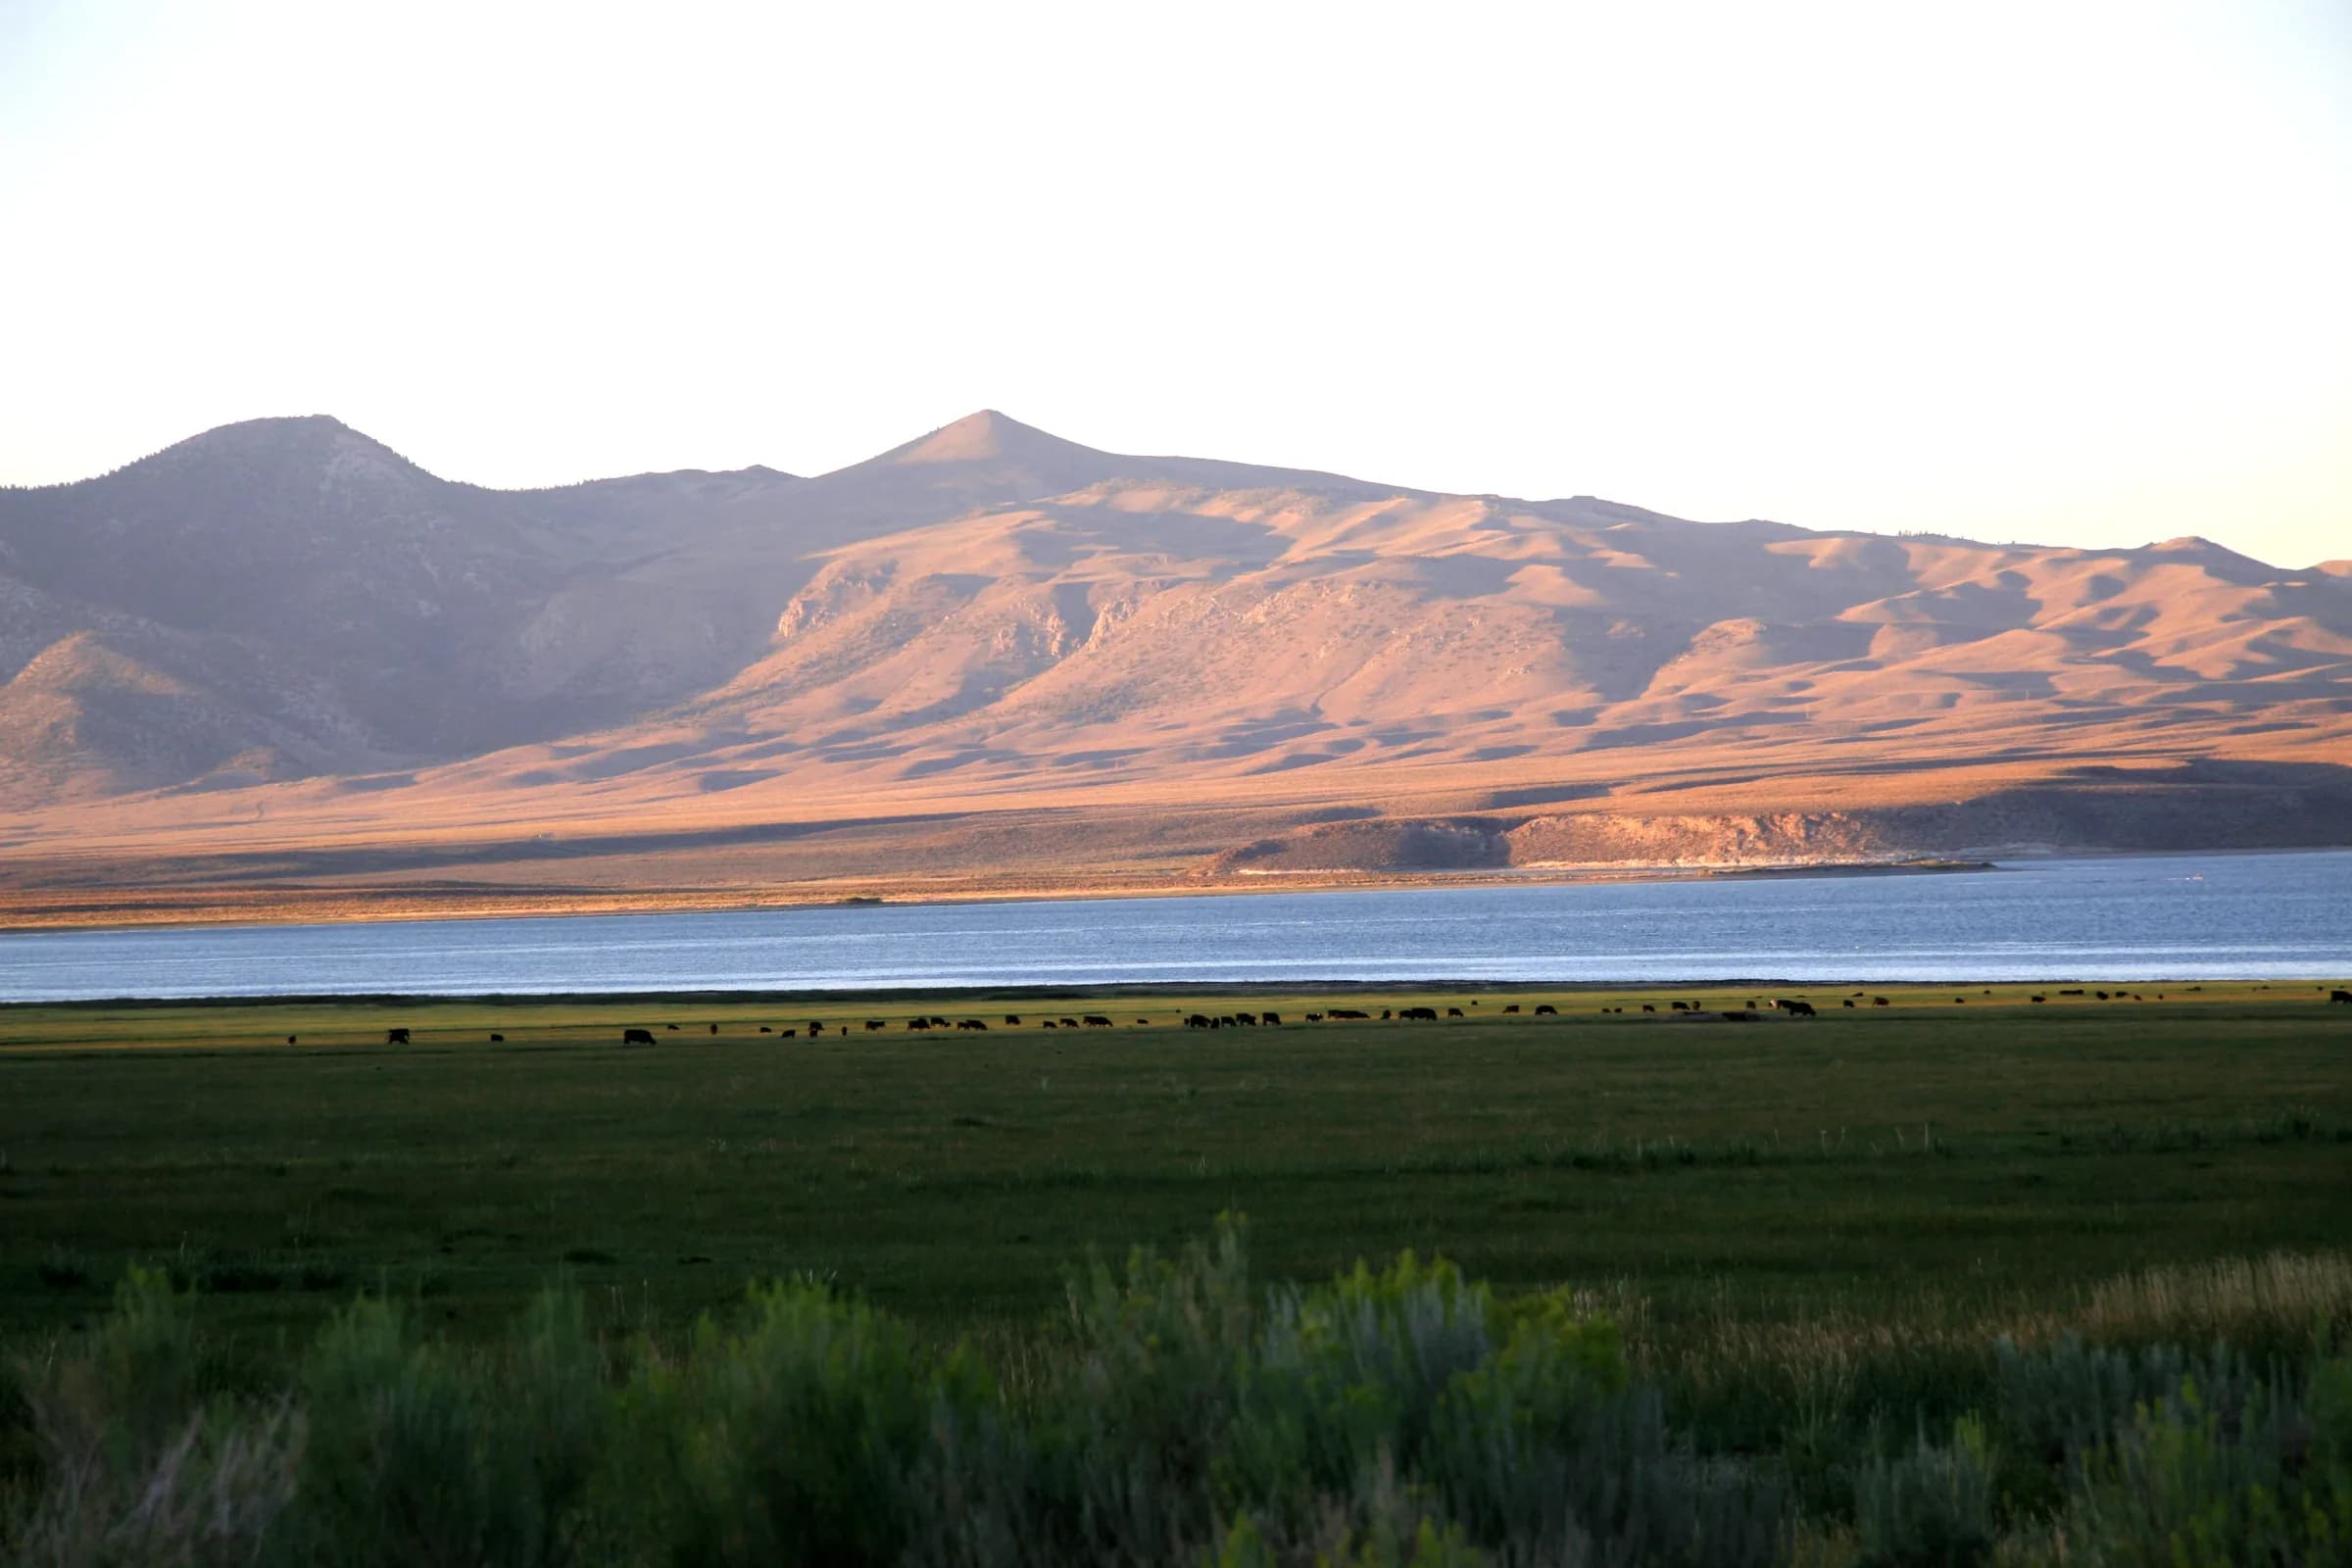
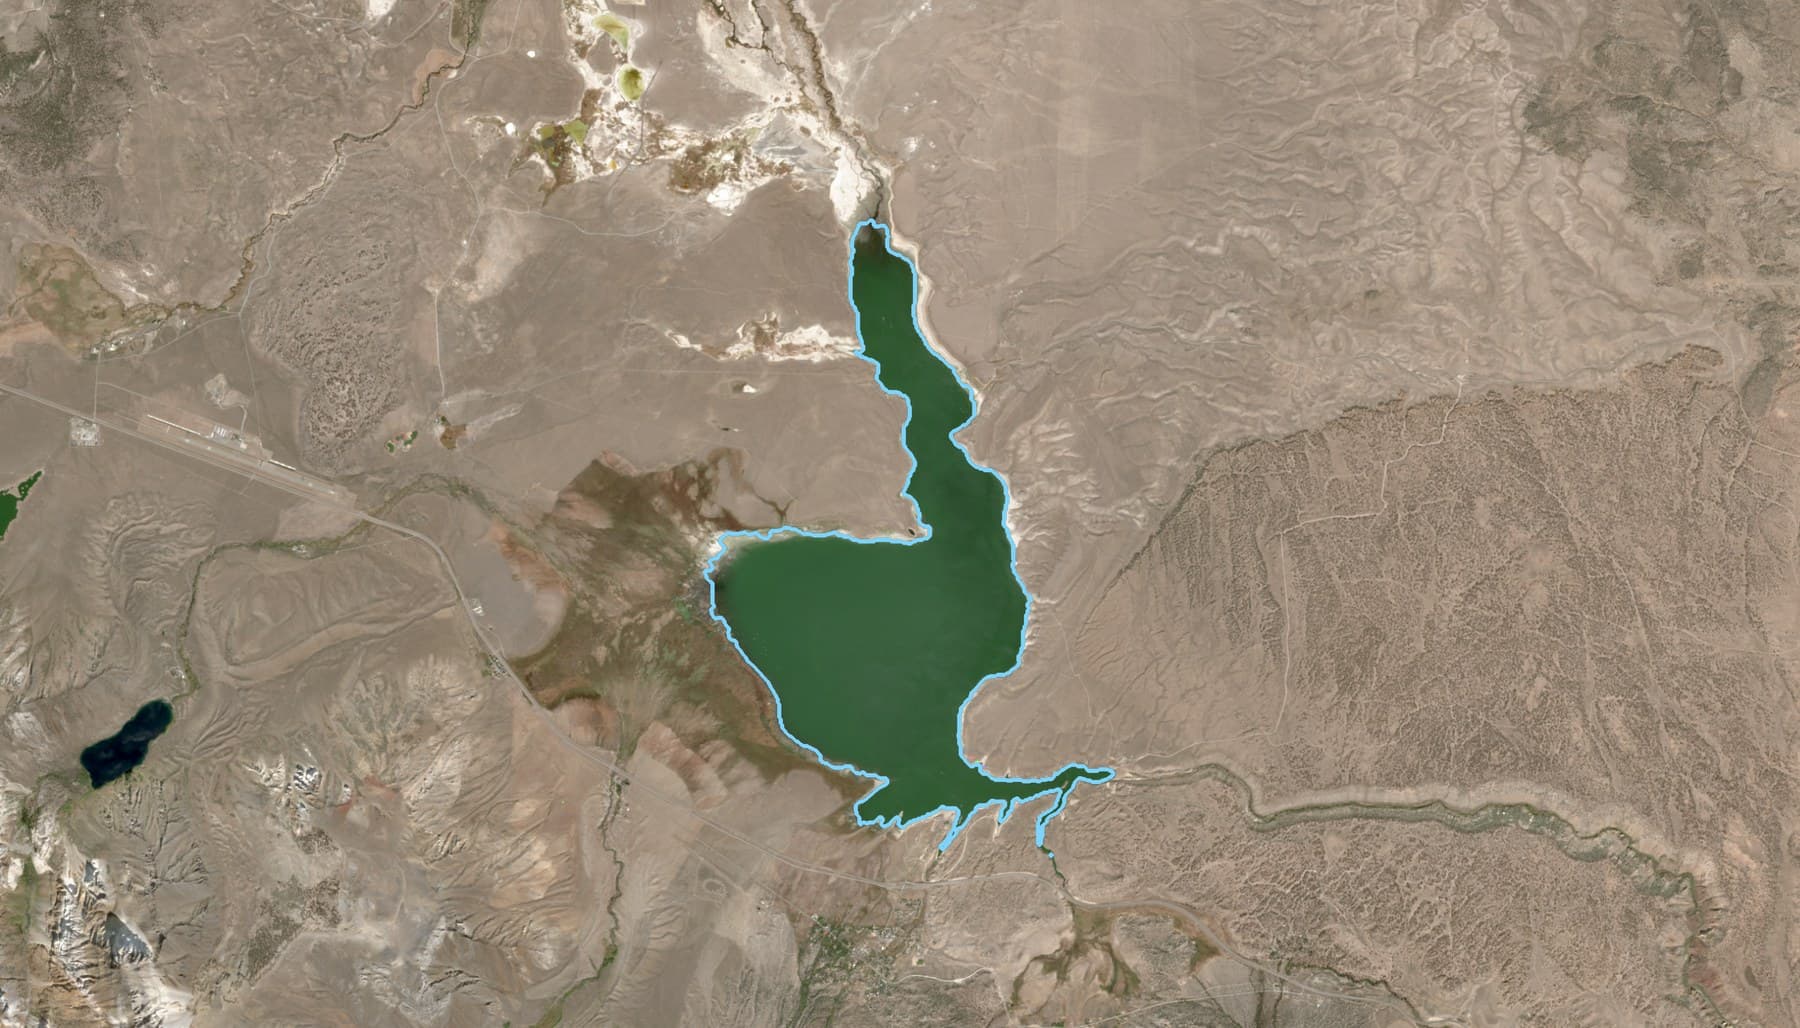
The largest reservoir in the Los Angeles Department of Water and Power’s system, in the Long Valley Caldera. Harmful algal bloom advisories have been issued here every year since 2021.
Amelia Space Technologies analyzes how environmental and human factors interact at planetary scale. For a lake, that means the watershed, the rivers that feed it, the weather, and the people who depend on it, together with measurements on the ground.
This case study focuses on the part satellite images play. Every clear image of Crowley Lake from May to September 2026 was measured and compared with the same weeks in prior seasons, back to 2017, beside the public advisories posted at the marina.
Planetary scale systems thinking
Understanding algal blooms in a lake starts with the environmental system that drives them: for Crowley Lake, the watershed, the rivers that feed it, the weather, and the people who depend on it.

Weather and climate
Air temperature, wind, sunlight, and snowmelt timing set the pace of the stages below.
Watershed
Snowmelt, springs, soils, and land use supply the nutrients that reach the water.
Inflows and transport
Rivers, creeks, and transfers bring water, nutrients, and heat in.
The lake or reservoir
Warm, still, layered water and a long stay let algae grow; wind gathers them into bays.
Outcomes
What people act on: advisories, health risks, the fishery, and the water supply.
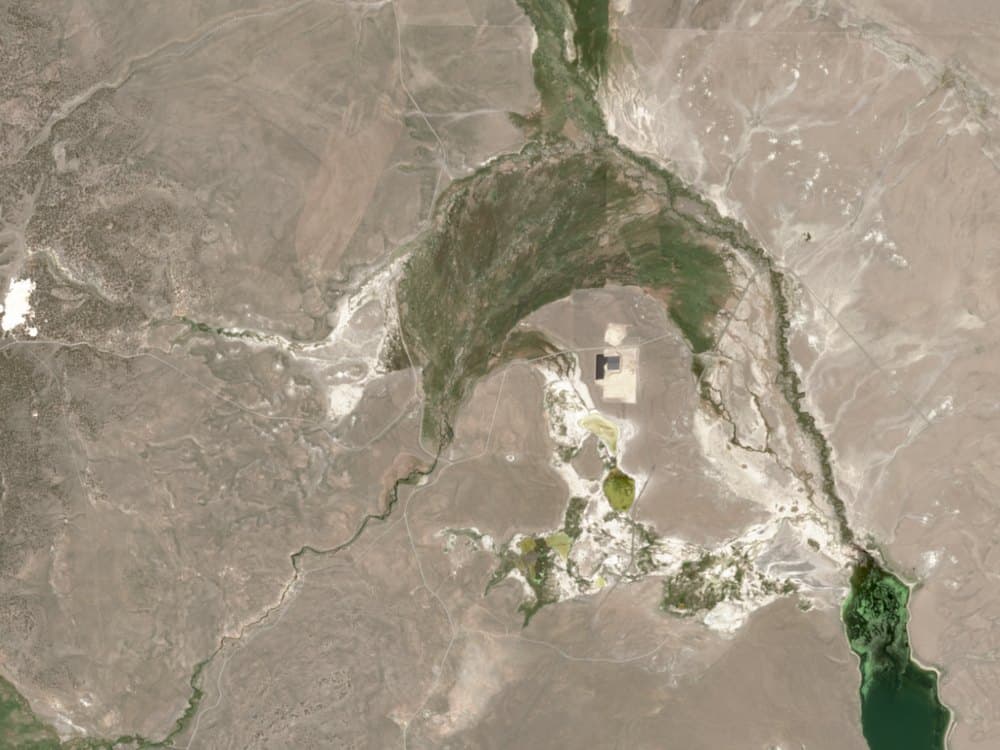
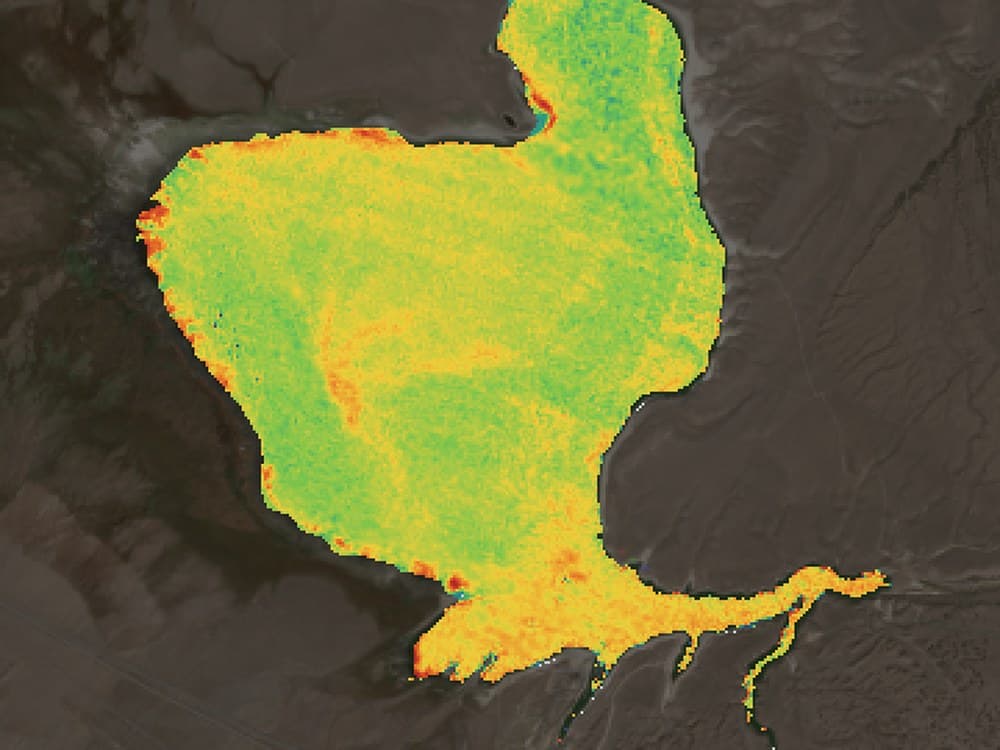
Image by image
Crowley Lake, May to September 2026
How satellite imagery contributes to a better understanding of algal blooms: each clear satellite image is measured, and compared with the same weeks in prior seasons, back to 2017. The chart places every clear image of 2026 on the day it was taken; the pictures below are fifteen of them. The white dot on each picture is South Landing Marina, where the advisories were posted.
- each clear image, in the same colors as the pictures below; the larger dots are the pictures shown
- higher than usual for the date
- advisory posted at the marina
May 10 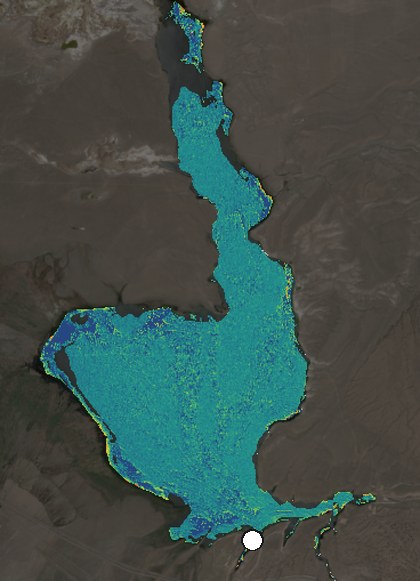
May 15unusual 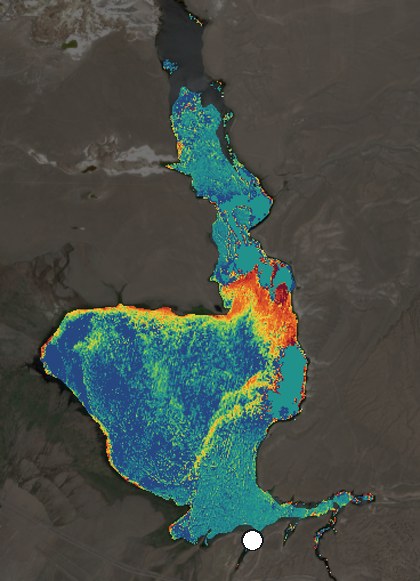
May 22unusual 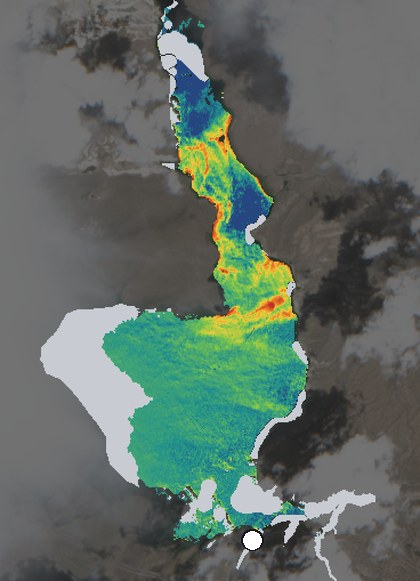
Jun 4unusual 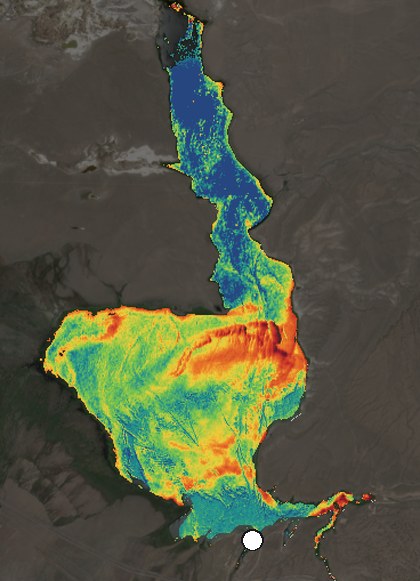
Jun 11unusual 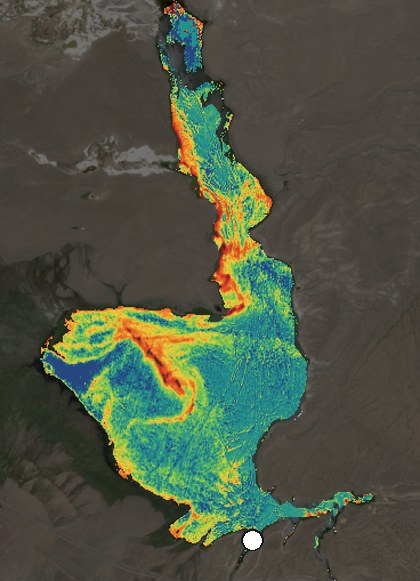
Jul 1 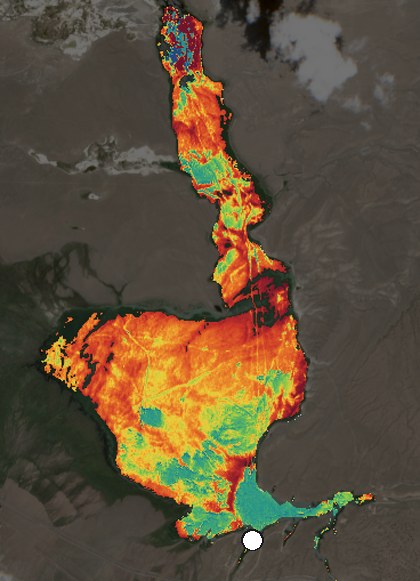
Jul 9 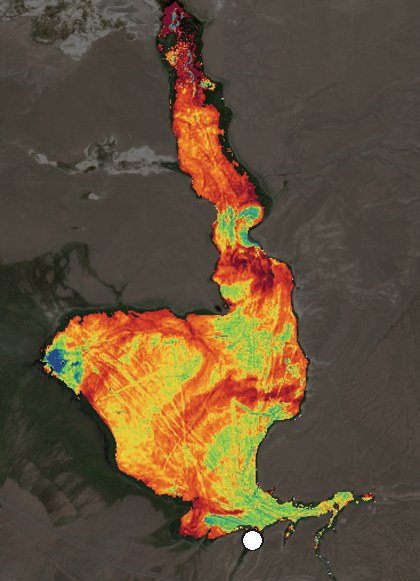
Jul 14 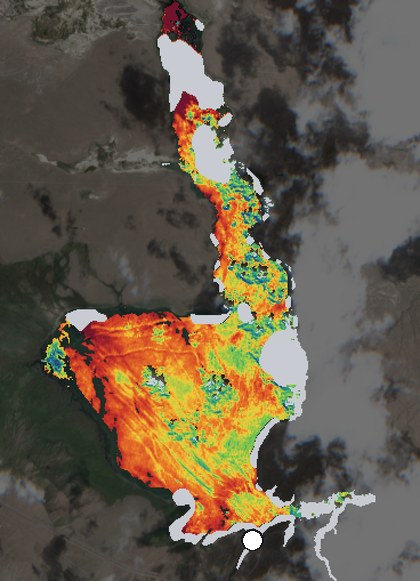
Jul 29 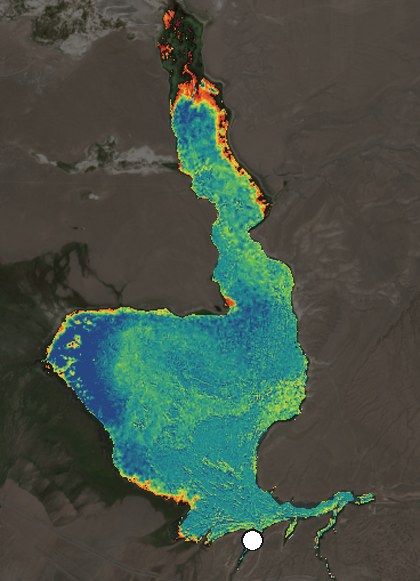
Aug 3 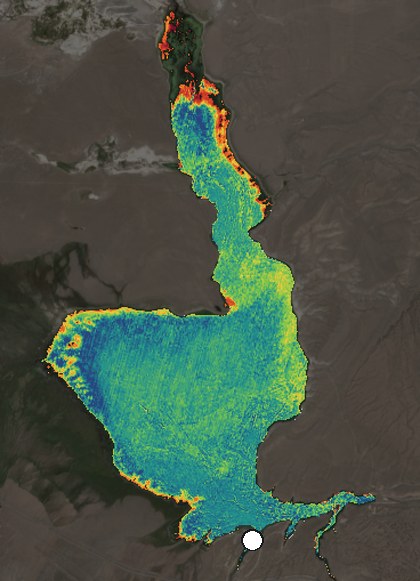
Aug 10 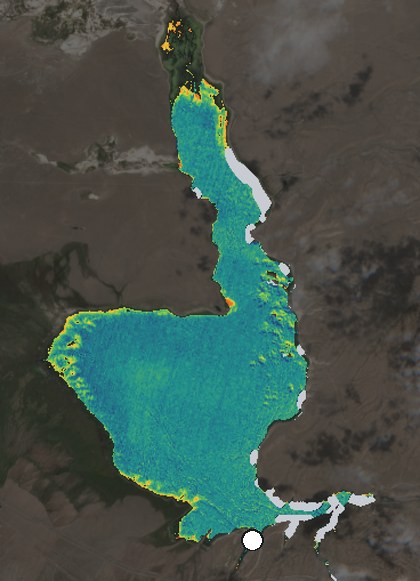
Aug 23 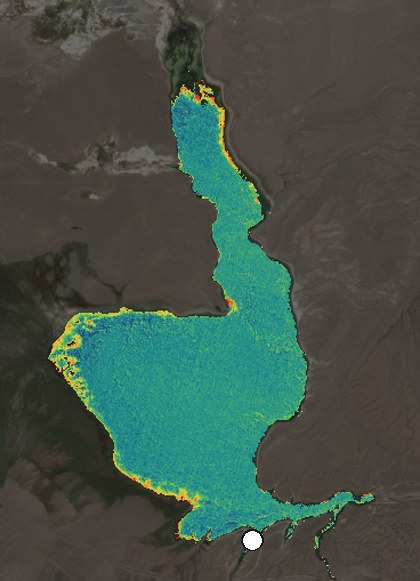
Sep 7 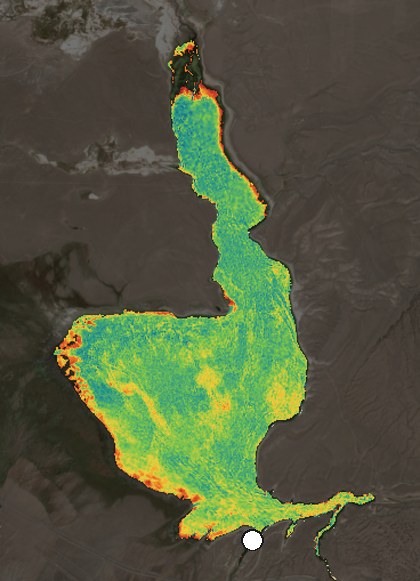
Sep 17 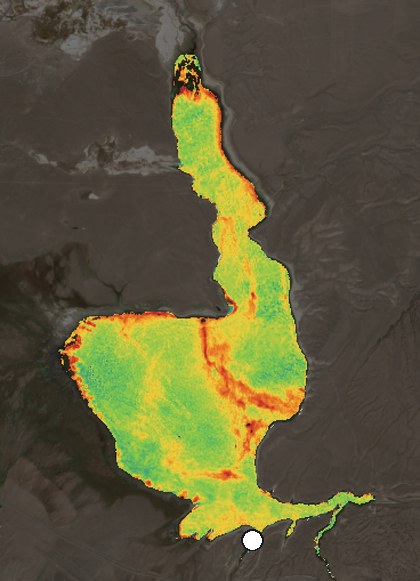
Sep 27 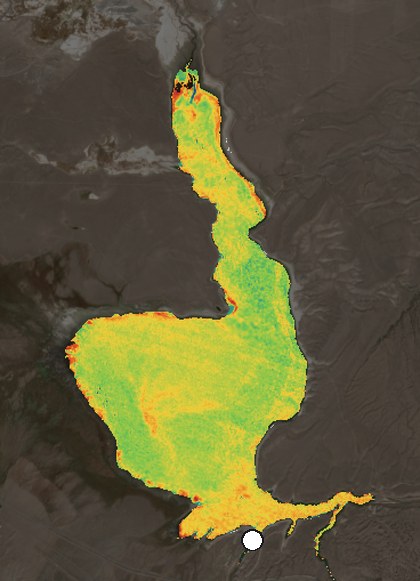
- water hidden by cloud
- South Landing Marina
Unusual from May 15
On May 15 the signal rose higher than usual for the date, earlier than in any season since 2020. It stayed higher than usual to June 14.
Seasonal trends
The signal stayed high from late May to mid-July, peaking July 9, then rose again from late August as the marina went to caution (Aug 28) and danger (Oct 2).
Where the signal was strongest
On September 27, the last clear pass, the greenest water was in the bay off the marina, the spot raised to danger on Oct 2.
How to read the chart and the pictures
Each dot is one clear satellite image, in the same color as its picture. Its height is the chlorophyll signal: the level the greenest tenth of the water reaches, shown as its relative strength on one color scale for every date, not a concentration. The signal is an index of the water’s color. Shallow water, sediment, and floating plants can raise it, and it says nothing about toxins or whether the water is safe. Water hidden by cloud or cloud shadow is painted gray, and cloudy days leave gaps between images.
A dark ring marks an image higher than usual for the date, compared with the same weeks in prior seasons at Crowley Lake, back to 2017. That is a comparison with the lake’s own past: not a finding of a bloom, and not a prediction. Looking back, not a forecast: the advisories were not issued from this screen, and advisories rest on water samples, which show what no image can, which organisms are present and whether toxins are in the water.
Questions and answers
What happened at Crowley Lake in 2026?
On August 28, 2026, the California Water Boards posted a caution advisory at South Landing Marina and a danger advisory at the Hilton Creek drainage, after a bloom more than a football field long was seen along the shore near South Landing. On October 2, the marina was raised to danger after testing found exceptionally high toxin levels. Both advisories are public, and neither was issued from satellite images.
Where is Crowley Lake?
Crowley Lake is in Mono County, California, in the Long Valley Caldera on the eastern side of the Sierra Nevada. It is the largest reservoir in the Los Angeles Department of Water and Power’s system. The Upper Owens River flows in at the north end, and water leaves through Long Valley Dam into the Owens River Gorge. South Landing Marina is on the south shore.
How often has Crowley Lake had harmful algal bloom advisories?
Every year since 2021. Public advisories were posted in 2021, 2022, 2023, 2024, 2025, and 2026, and in each of those years an advisory reached the danger level, the highest of California’s three tiers, according to the California Water Boards and the local news reports listed in the sources below.
What do the satellite images show?
Each clear image is painted with a chlorophyll signal: an index of the water’s color, from lower (blue) to higher (dark red), on one scale for every date. It is not a measurement of chlorophyll concentration, and it says nothing about toxins or whether the water is safe. Shallow water, sediment, and floating plants can raise it, and water hidden by cloud is left gray.
How does the screening decide an image is unusual?
Each clear image gives one reading: the level the greenest tenth of the water reaches, relative to this lake, not a concentration. The reading is compared with the same weeks in earlier seasons at Crowley Lake, back to 2017, and a reading well above them is marked higher than usual for the date. That is a comparison with the lake’s own past, not a finding of a bloom and not a prediction.
Did satellite images show the 2026 bloom before the advisories?
Looking back, not a forecast: the advisories were not issued from this screen. The signal rose higher than usual for the date on May 15 and stayed unusual until June 14. It stayed high to mid-July, peaking on July 9, and rose again from late August, when the caution (August 28) and danger (October 2) advisories were posted at the marina. The images say nothing about toxins; advisories rest on water samples.
Can satellite images show harmful algal blooms?
Satellite images show the chlorophyll signal across the whole water surface on clear days, between samples. Chlorophyll is the green pigment in algae and in cyanobacteria, so a rising signal can point to a bloom but cannot identify one on its own, and it cannot say whether toxins are present. An unusual reading is a prompt to look, not a test result.
What is a harmful algal bloom?
An algal bloom is a rapid build-up of algae or cyanobacteria in a lake, reservoir, river, or the sea, often in warm, calm, sunny weather when nutrients are plentiful. A bloom is called harmful when it produces toxins, causes taste and odor problems, uses up oxygen as it decays, or otherwise harms people, animals, or the water supply. In lakes and reservoirs, harmful blooms are most often cyanobacteria, often called blue-green algae.
Does satellite screening replace water sampling?
No. Samples cover a few points; images show the whole surface on clear days. California’s advisories rest on toxin tests and field observations, and only a sample can show which organisms are present and whether toxins are in the water. Satellite screening is one component, together with sampling, the watershed, and the weather, and an unusual reading can prompt an extra sample between rounds.
Where else could this screening help?
At any lake or reservoir large enough to see from orbit: drinking-water reservoirs, between laboratory samples; recreational lakes with seasonal advisories; and water bodies whose managers want each season compared with the ones before it. It needs clear days, because cloud and cloud shadow hide the water.
Sources and credits
Contains modified Copernicus Sentinel data 2017 to 2026. Outlines and places © OpenStreetMap contributors (ODbL). Weather: Open-Meteo. Globe: NASA Blue Marble. Photograph of the lake: Dcrjsr, Wikimedia Commons, CC BY 3.0.
Crowley Lake advisories: the State Water Resources Control Board and local news, 2021 to 2026. 2026: the Water Boards’ advisories of August 28 and October 2. 2025: August 22. 2024: July 5 (Eastern Sierra Now) and October 4. 2023: June 16 (KOLO) and August 30 (Lassen News). 2022: September 1 (Sierra Wave). 2021: August 27 (The Sheet). Current advisories: the California Harmful Algal Blooms Portal.
A technical note on the method is available on request.
Next step
Start with one water body
- Name a lake or reservoir that matters to you.
- Agree on the scope and cost of the screening and the system map.
- Walk through the record together, with your own samples alongside.