

Ports, landfills and industrial sites
Invisible emissions, and why seeing them pays
Most of what a port, landfill or industrial site emits is invisible to the eye. Some emissions are fuel escaping, some now carry a carbon price, and more of them reach the public record every year. Seeing emissions tells you what to fix first, what you can recover and how to answer anyone who asks.
Published 1 October 2026
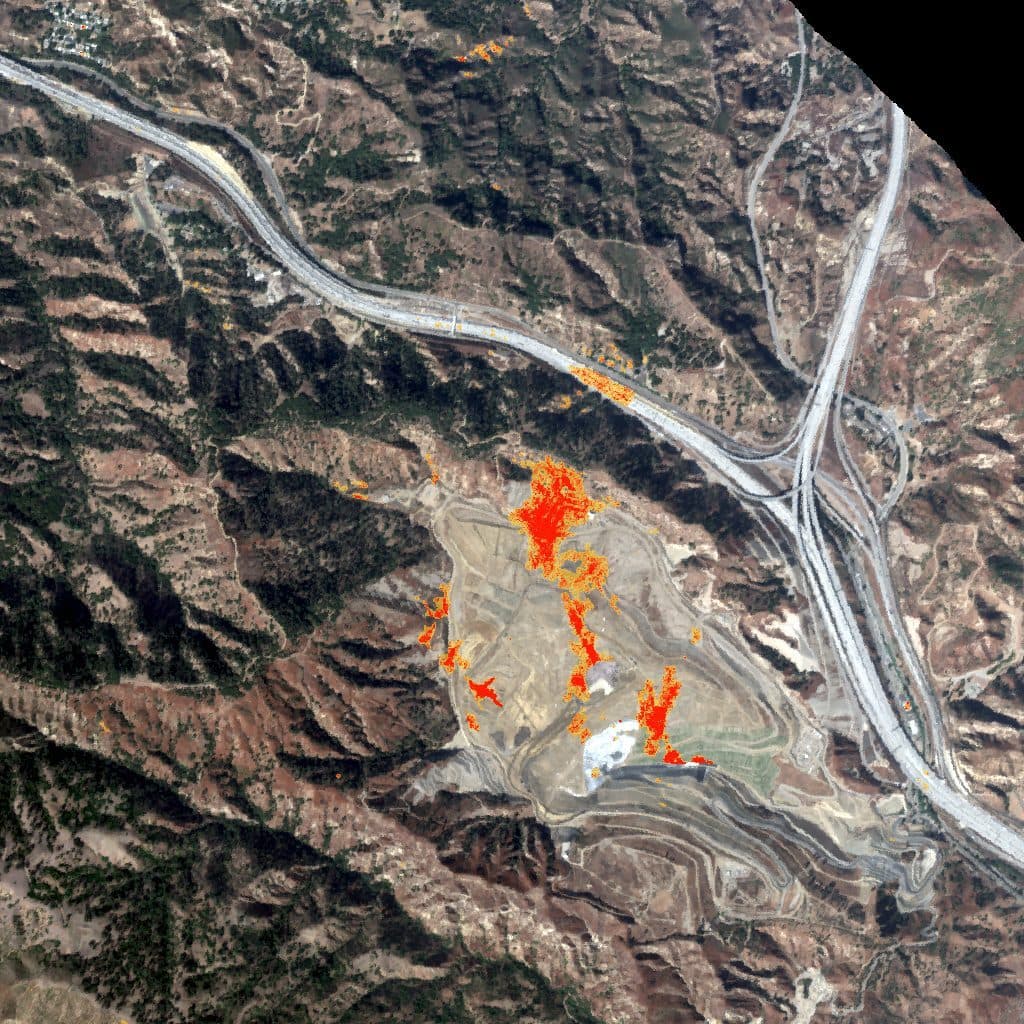
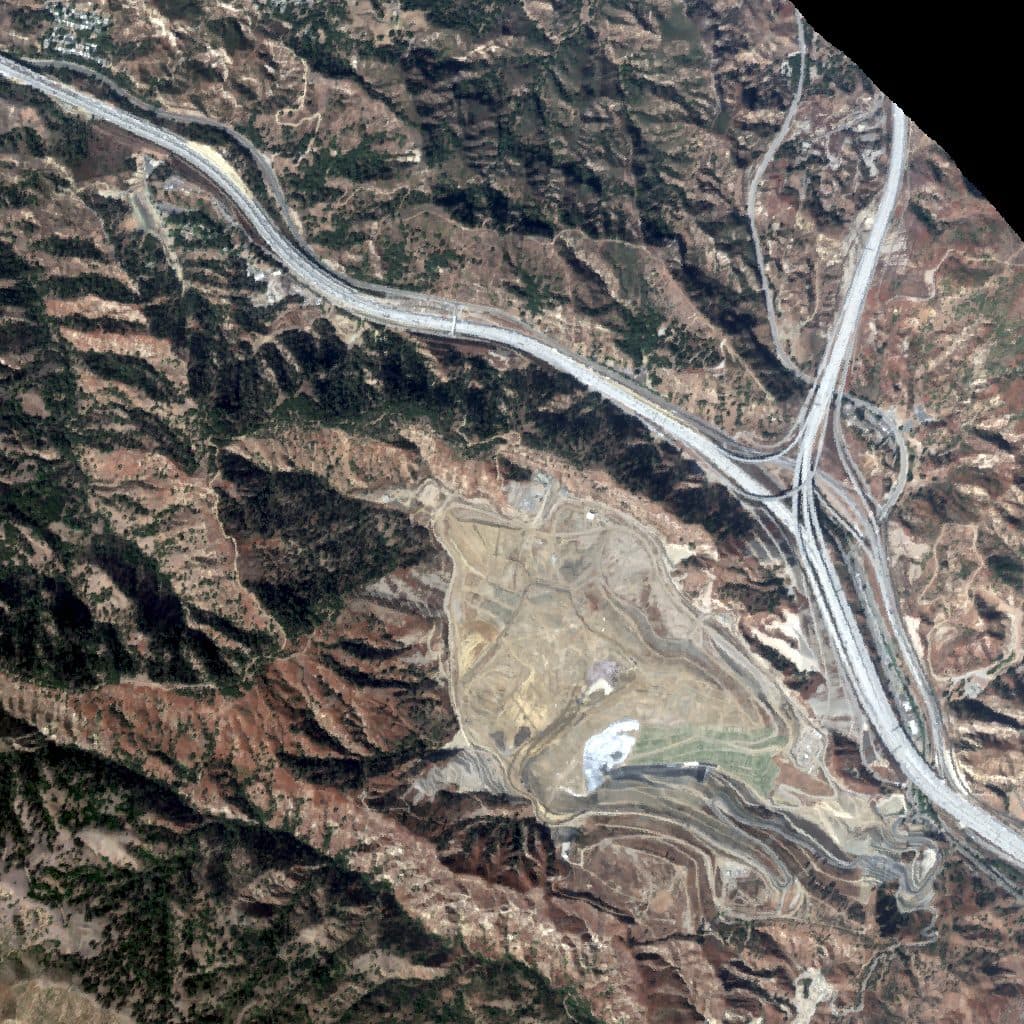
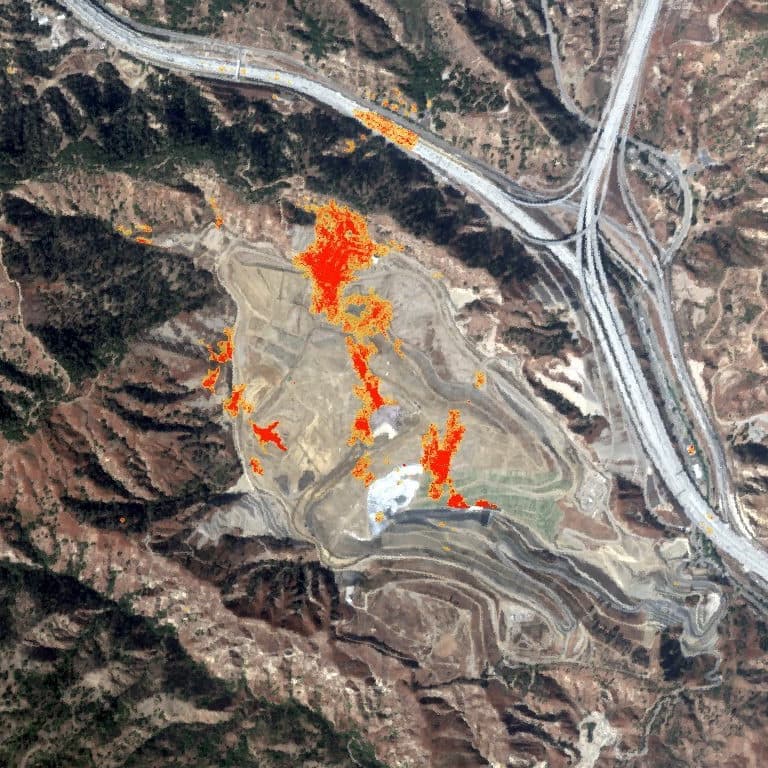
Drag across the landfill below and six methane plumes appear, together about 5 tonnes of methane an hour, none of them visible to the eye. The sections that follow show large emission sources seen from orbit at industrial sites and ports, then the same landfill over ten years, where checking the public record changed how fast the landfill's methane appears to have risen.
Why it matters
Methane escaping a landfill or a gas site is fuel lost: captured, landfill gas generates electricity or is upgraded to renewable natural gas, and a leak found early is gas that can still be sold. Emissions from ships at berth now carry a price too, because European trading schemes charge for those emissions. A few large sources usually account for most of the methane a region emits: in a survey of California, a tenth of the methane sources seen from the air produced about 60% of the methane measured. Knowing which of your sources are the large ones tells you where to act first, and because satellites now image every site whether or not its operator asked, the operator with the complete record is the one whose numbers hold up.
This story visits
- 1Sylmar, Los Angeles34.33°N 118.52°W
- 2Falkirk, Scotland55.92°N 3.74°W
- 3Houston Ship Channel, Texas29.71°N 95.13°W
- 4Fos-sur-Mer port, France43.45°N 4.85°E
What satellites can see
Large sources are visible from orbit
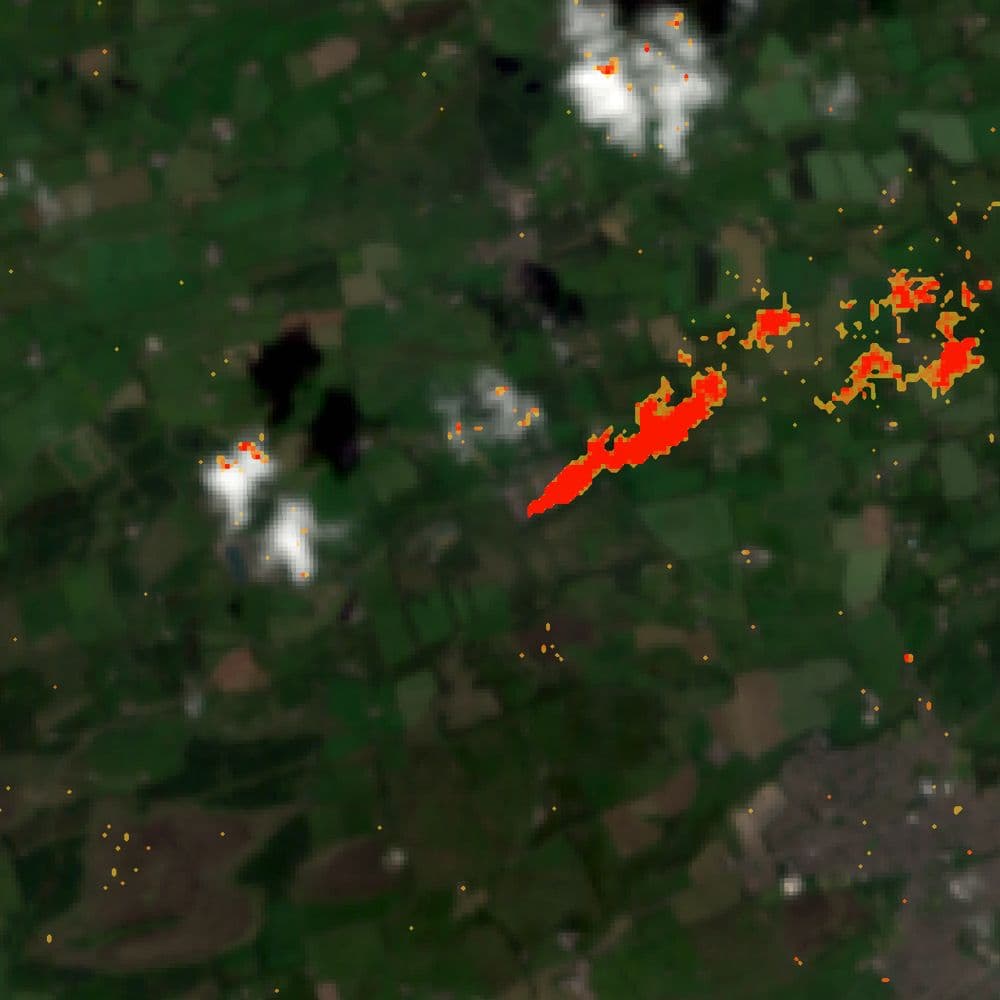
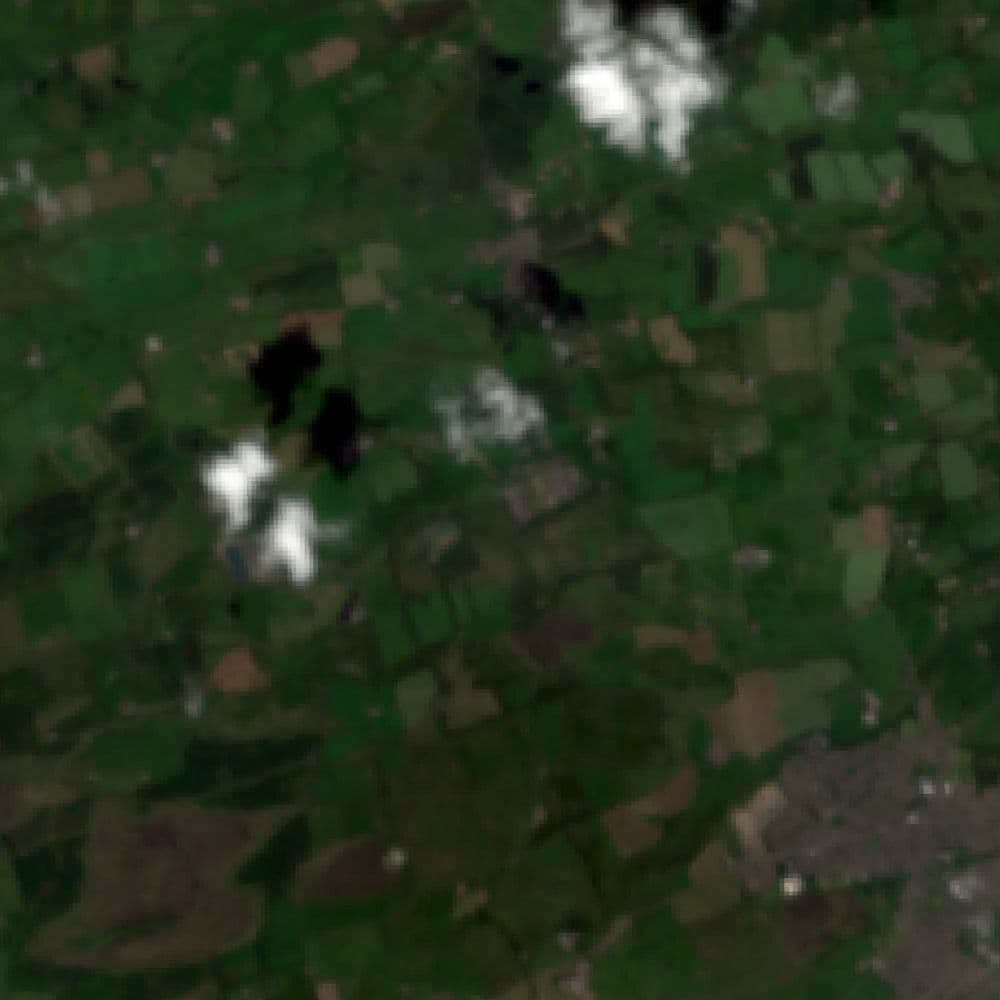
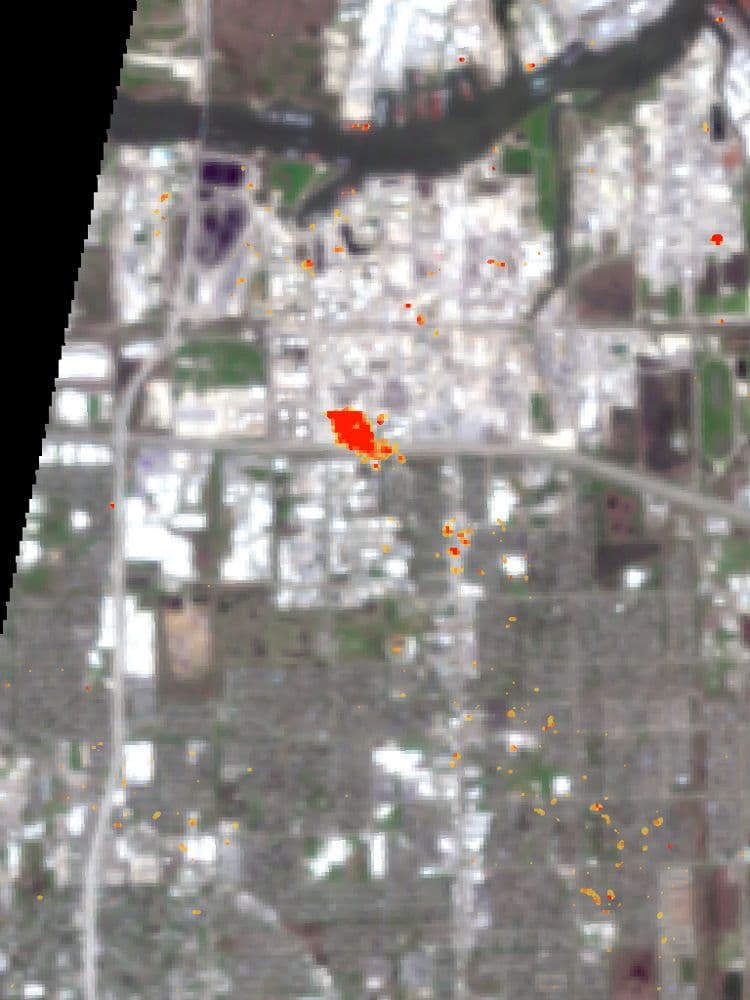
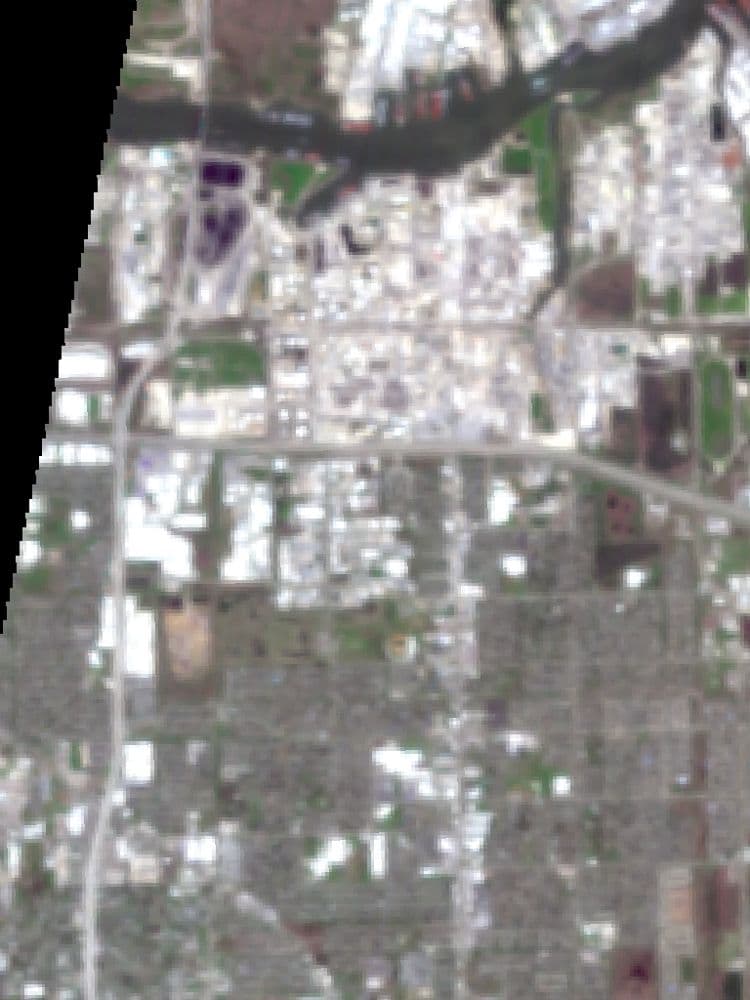
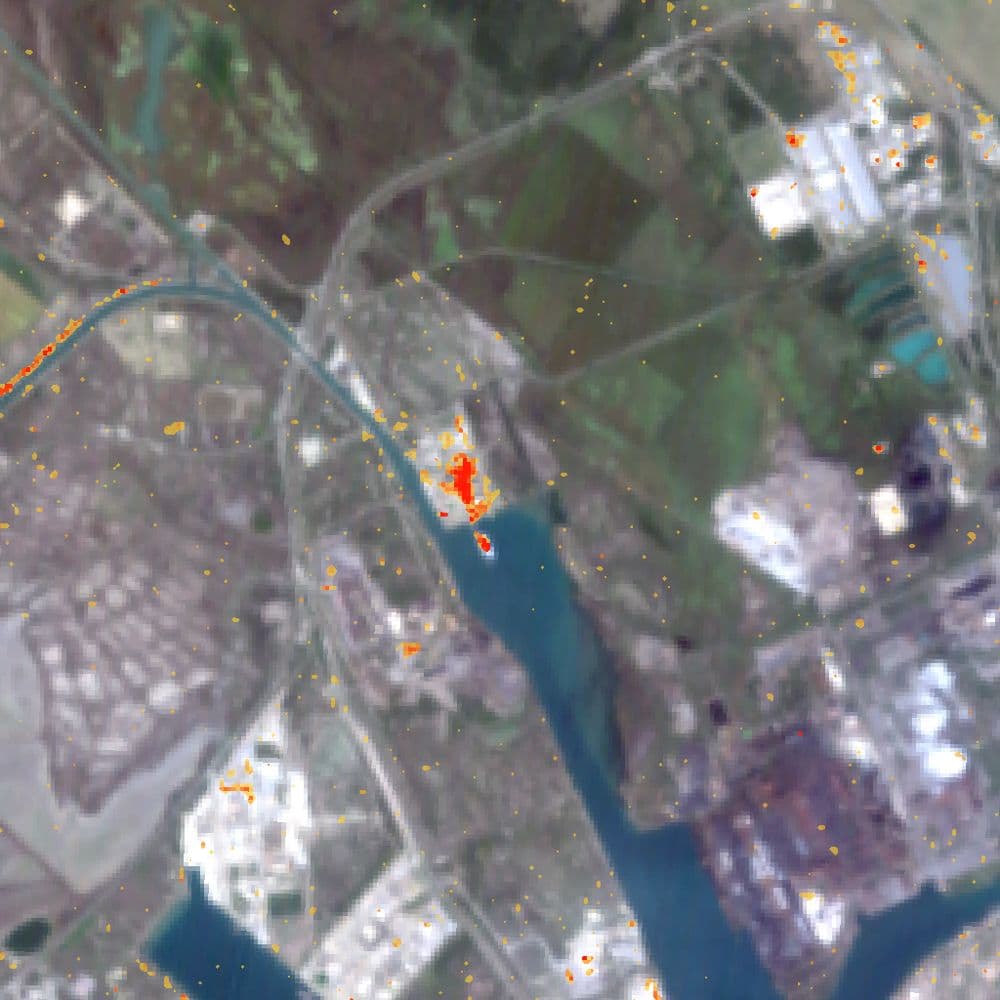
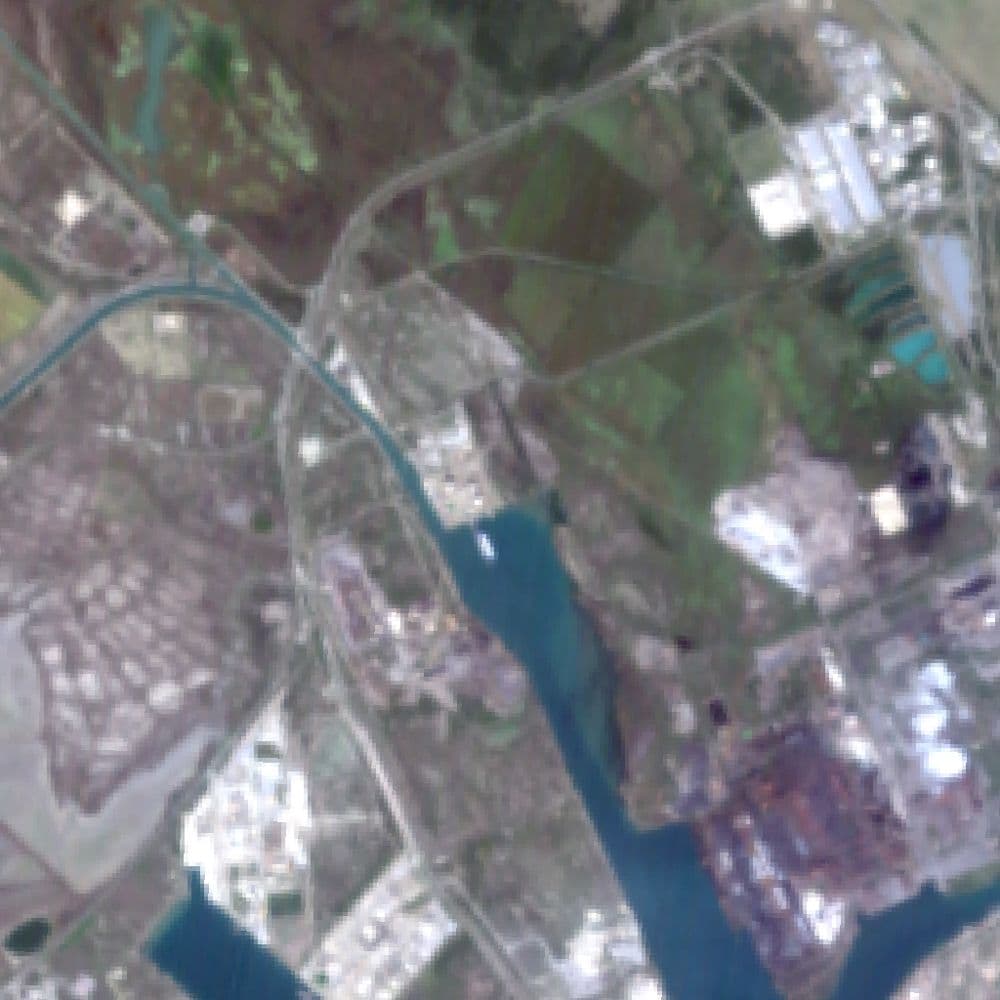
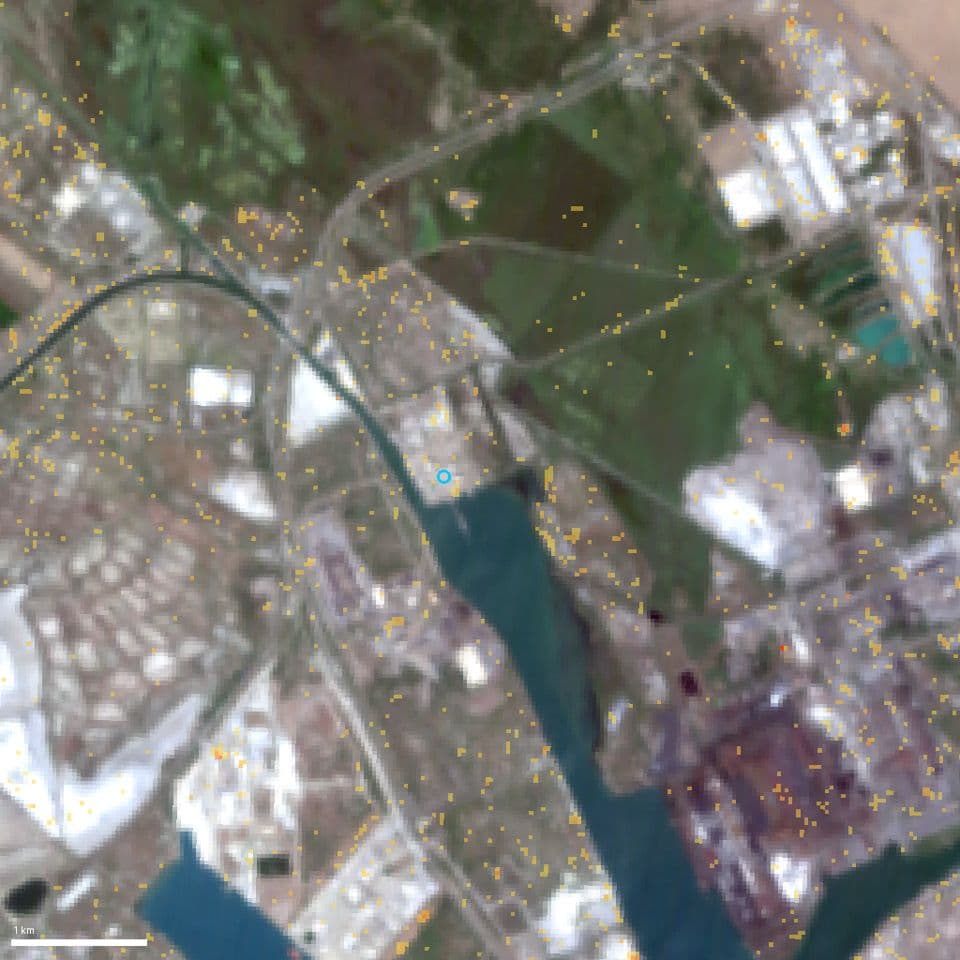
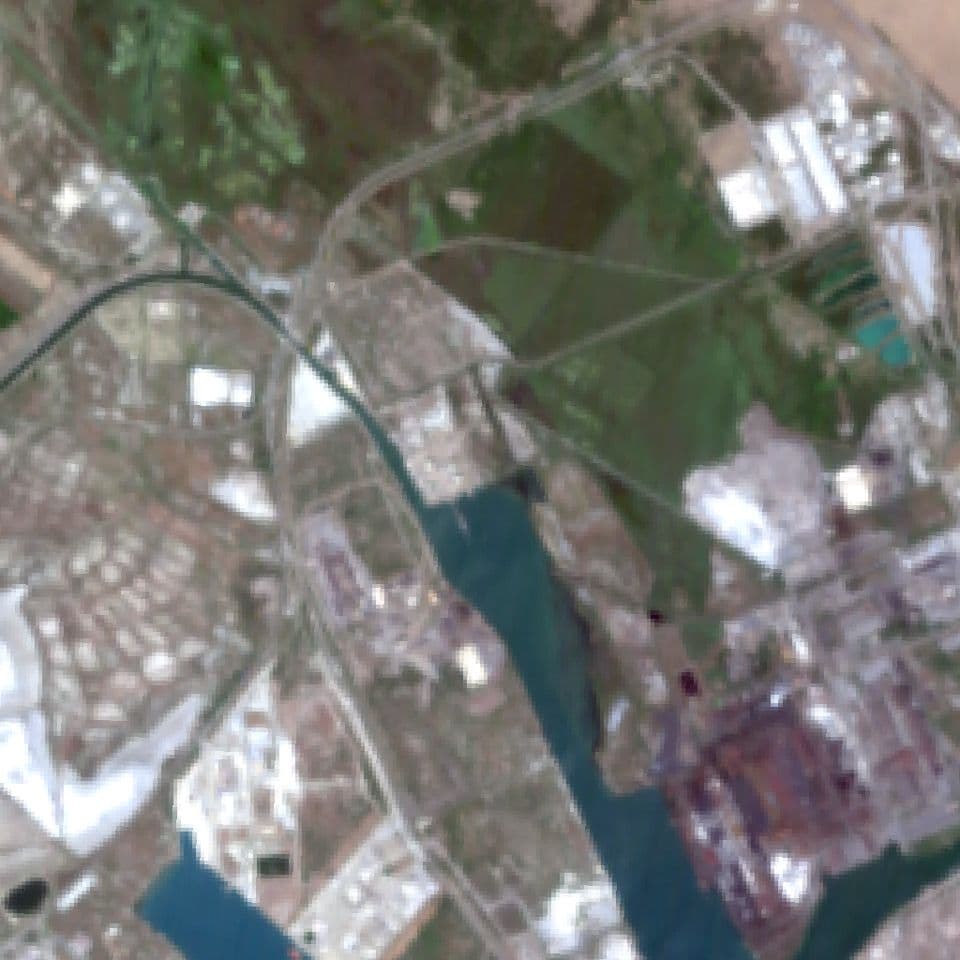
Satellites that measure methane and carbon dioxide now pick out large emission sources from orbit. In these examples, published by Carbon Mapper, the true-color image shows an ordinary industrial landscape while the sensor shows the gas. Drag across each image to reveal the gas.
Where on Earth
- Falkirk, Scotland55.92°N 3.74°W
- Houston Ship Channel, Texas29.71°N 95.13°W
- Fos-sur-Mer port, France43.45°N 4.85°E
Case study: a landfill over ten years
Ten years of methane at one landfill
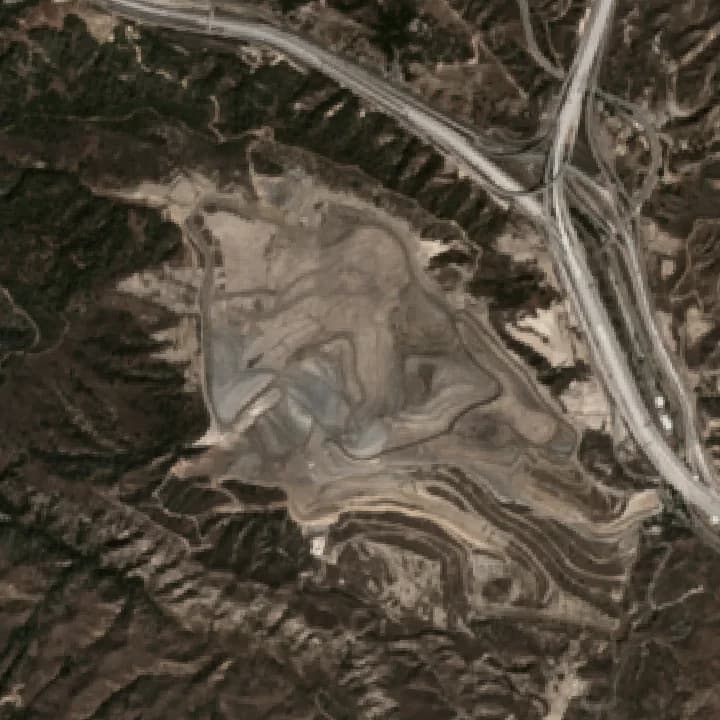
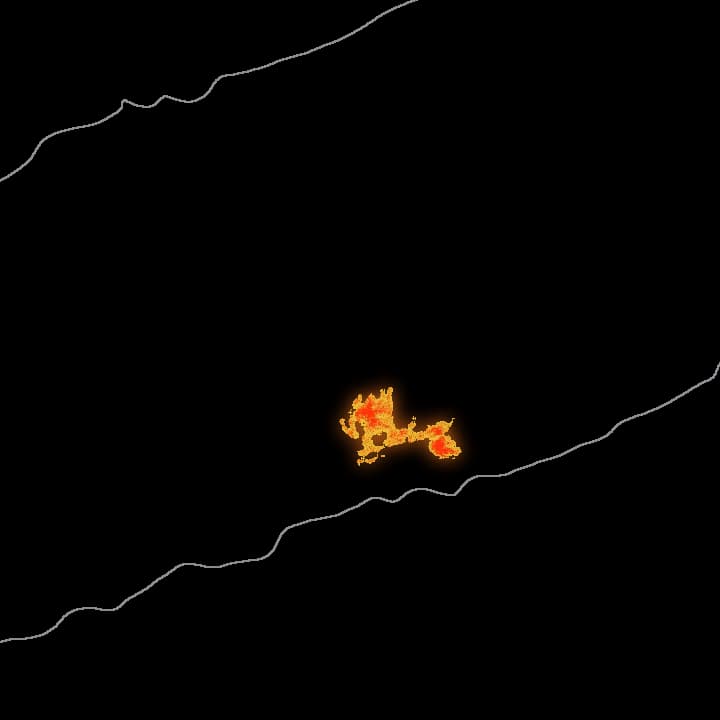
Aircraft first measured methane at this landfill in September 2016, during a statewide NASA survey. Since then aircraft and satellites have observed the landfill on 67 days. Each frame below shows one of those observations over a cloud-free satellite image of the ground taken within 30 days, so you can follow the working landfill as its surface changes and see where the methane rises. The frame covers the same 2.8 km square every year, and the bar beside the frame shows that year's average on a fixed scale.
Typical reading
3 October 2016AVIRIS-NG aircraft1,664 kg/h measured, 1 plumeGround image: 3 September to 2 November 2016That year's average
Measured on 6 days. The range allows for observations whose imagery could not be checked, and counts those that found no plume at zero or at the sensor's detection limit.
- Aircraft
- Satellite
- Yearly average
- Range from observations that could not be checked
Grey dots at zero are days with nothing above the detection limit, hollow where those observations could not be checked. Days above 4,000 sit on the top line.
What checking the record changed
- Average methane
- Before checking: 1,142 kg/hAfter checking: 1,330 to 1,470 kg/h
- Rise since the flights of 2016 and 2017
- Before checking: Six-foldAfter checking: 2.5 to 5×
Taken at face value, the public record overstates how fast this landfill's methane grew and understates how much methane the landfill emits.
- of methane released over ten years, at least. Over a century, that much methane warms the climate as much as about 2.8 to 3.4 million tonnes of carbon dioxide.
- 104,000 to 113,500 t
Why every observation is checked
How often a source was seen only means something once you know which observations could have seen the source. The public list of observations at this landfill includes aircraft scenes whose outline reaches the landfill while the aircraft's imaging strip passes beside the landfill. Of the 186 recorded observations, 28 could not have covered the area where the plumes rise and 19 covered only part of that area, and most of these were flights in 2016 and 2017 that saw nothing. Counted in, those observations made the early years look cleaner than they were and the rise look six-fold. They also pull the published average for this landfill, 1,142 kilograms an hour, below the 1,330 to 1,470 found once they are set aside.
For ports, landfills and industrial sites
What seeing emissions lets you do
Amelia Space Technologies combines satellite, aircraft and ground observations of your site with your own records into one picture of what the site emits, where the emissions come from and how they are changing. Four things follow from that picture.
Fix the largest sources first
A few large sources usually produce most of the methane in a region. Knowing which of your sources are the large ones puts repairs and investment where they pay back first.
Recover what is escaping
Methane is fuel. Captured, landfill gas generates electricity or is upgraded to renewable natural gas, and a leak found early at a gas site is product that can still be sold.
Cut what emissions cost you
Ships now pay for their emissions at berth in European ports. Evidence of when and where those emissions happen makes the case for shore power, cleaner operations and the investment behind them.
Answer anyone with evidence
Regulators, auditors, investors and neighbors can all read public data about your site. A record that shows what was measured, when, and what was not observed lets you answer each of them with confidence.
Customer work uses data licensed for commercial use: public missions such as Copernicus and NASA, commercial satellite providers, and your own sensors and records. The Carbon Mapper data in this article is used under its non-commercial terms.
See your site's record
If you operate a port, a landfill or an industrial site, find out what the public record already says about your site, where the gaps are, and what closing those gaps would take.
Questions and answers
What does Amelia give a port or site operator?
A clear picture of what your site emits, which sources are largest and how they are changing, built from satellite, aircraft, ground-sensor and ship data and your own records. Every observation records what the instrument could and could not see, so the figures hold up with regulators, auditors and carbon markets.
How do satellites and aircraft detect methane?
Satellites and aircraft carry imaging spectrometers that record sunlight reflected from the ground in hundreds of narrow wavelength bands. Methane absorbs light at characteristic wavelengths in the shortwave infrared, most strongly near 2,300 nanometers, so the light missing at those wavelengths maps the gas. The emission rate is then estimated from the mass of methane in the plume and the wind speed.
Can satellites see methane from ships?
Not yet at the sizes measured at berth. An LNG tanker unloading at berth was measured at 24 to 40 kilograms of methane an hour, while a typical summer satellite scene detects sources of about 500 to 1,400 kilograms an hour nine times out of ten, depending on latitude. Over water, satellite methane measurements also generally need sunglint, so emissions from ships at berth are measured on board and from the ground, and a combined record sets those measurements beside what satellites see.
Why can a published emissions average be too low?
An average counts every observation of a source, including observations that saw nothing. If a recorded observation never covered the source, for example an aircraft strip that passed beside the source, counting that observation as one that saw nothing lowers the average. At the landfill in this article, leaving out such observations raised the average from 1,142 to between 1,330 and 1,470 kilograms an hour.
Where does the data on this page come from?
Plume detections and emission rates come from Carbon Mapper, which publishes measurements from aircraft and satellites. The combined record, the coverage checks and the calculations are Amelia's.
How much methane has the Sylmar landfill released since 2016?
At least 104,000 to 113,500 tonnes between September 2016 and July 2026, from published rates and assuming each year's average held between observations. Over a hundred years that much methane warms the climate as much as about 2.8 to 3.4 million tonnes of carbon dioxide. Sixty plumes in the record have no published rate, so the true total is probably higher.
Sources
Emission rates are Carbon Mapper's published estimates. Some plumes in the record have no published rate, so the averages and totals on this page are lower bounds.
Plume detections and emission rates come from Carbon Mapper. Other figures come from a 2019 study in Nature of California's largest methane sources, Carbon Mapper's 2025 paper on how it measures plumes, the IPCC on how strongly methane warms the climate, TNO and ICCT on methane from LNG ships at berth, the European Commission and the UK Government on emissions trading for shipping, a 2022 review by Jacob and colleagues of measuring methane from satellites, and the US EPA on landfill gas.
Data by Carbon Mapper® (data.carbonmapper.org), used under Carbon Mapper's non-commercial Terms of Use. Figures derived from Carbon Mapper data, which are the landfill images, the time-lapse overlays and chart, and the four satellite plume images, are shared under the same non-commercial terms and attribution. Carbon Mapper is not affiliated with this analysis and has not reviewed it. Instrument data from NASA's Jet Propulsion Laboratory and Arizona State University; use of NASA data does not imply endorsement by NASA. Tanager-1 imagery © Planet Labs PBC. Contains modified Copernicus Sentinel data 2016 to 2026. Text and analysis © 2026 Amelia Space Technologies, except the material credited above.